Charts · Income and living conditions
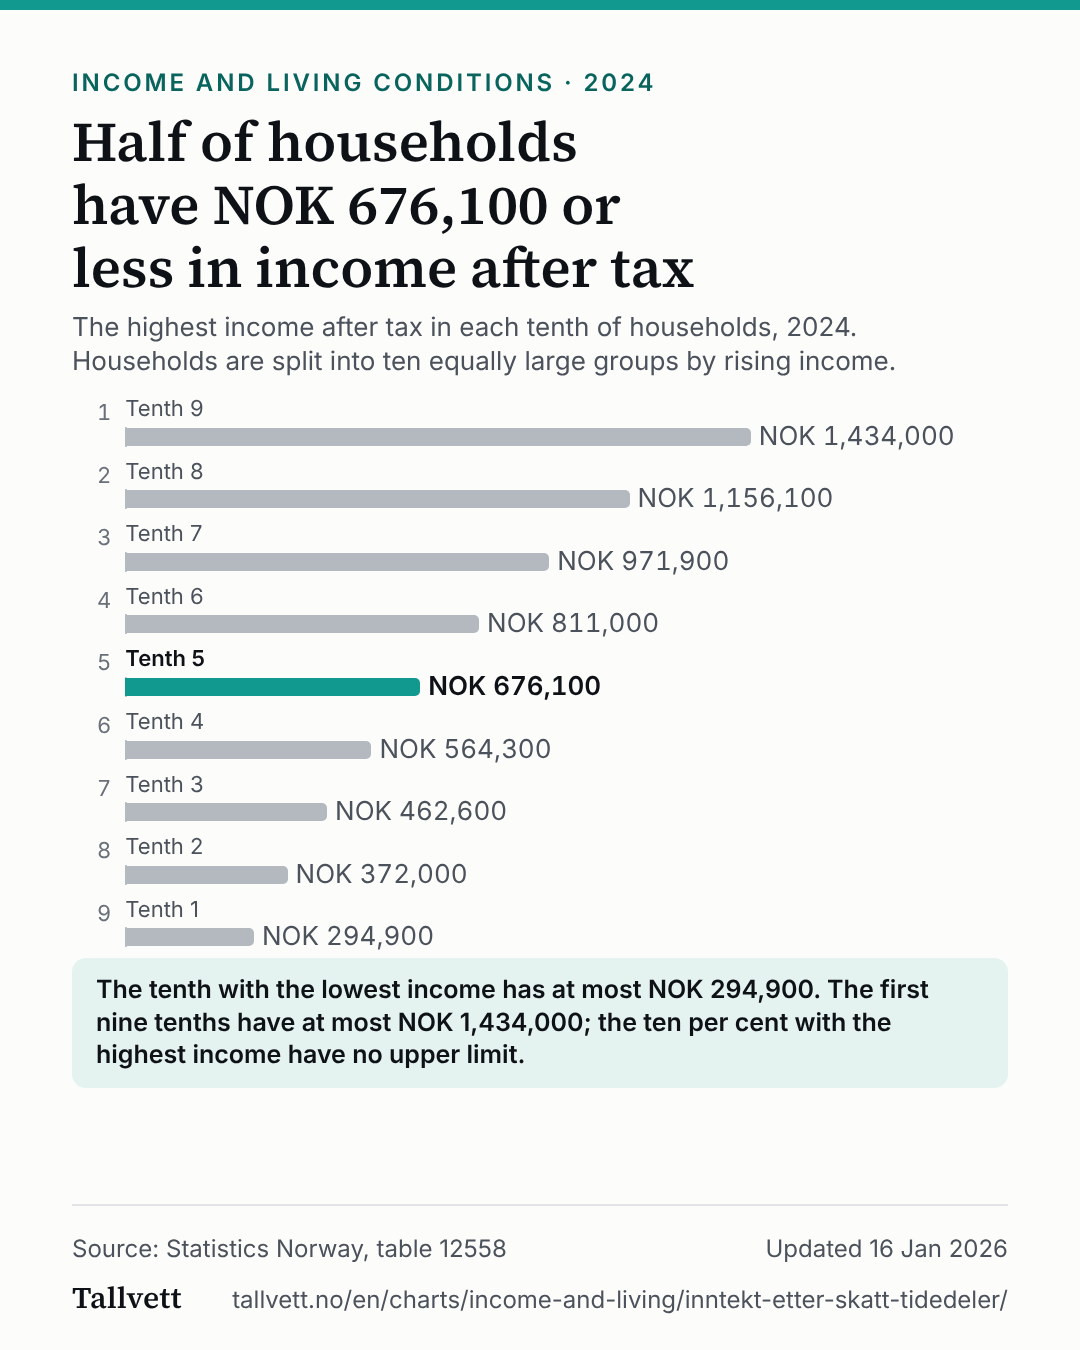
Half of households have NOK 676,100 or less in income after tax
Half of households have NOK 676,100 or less in income after tax
The highest income after tax in each tenth of households, 2024. Households are split into ten equally large groups by rising income.
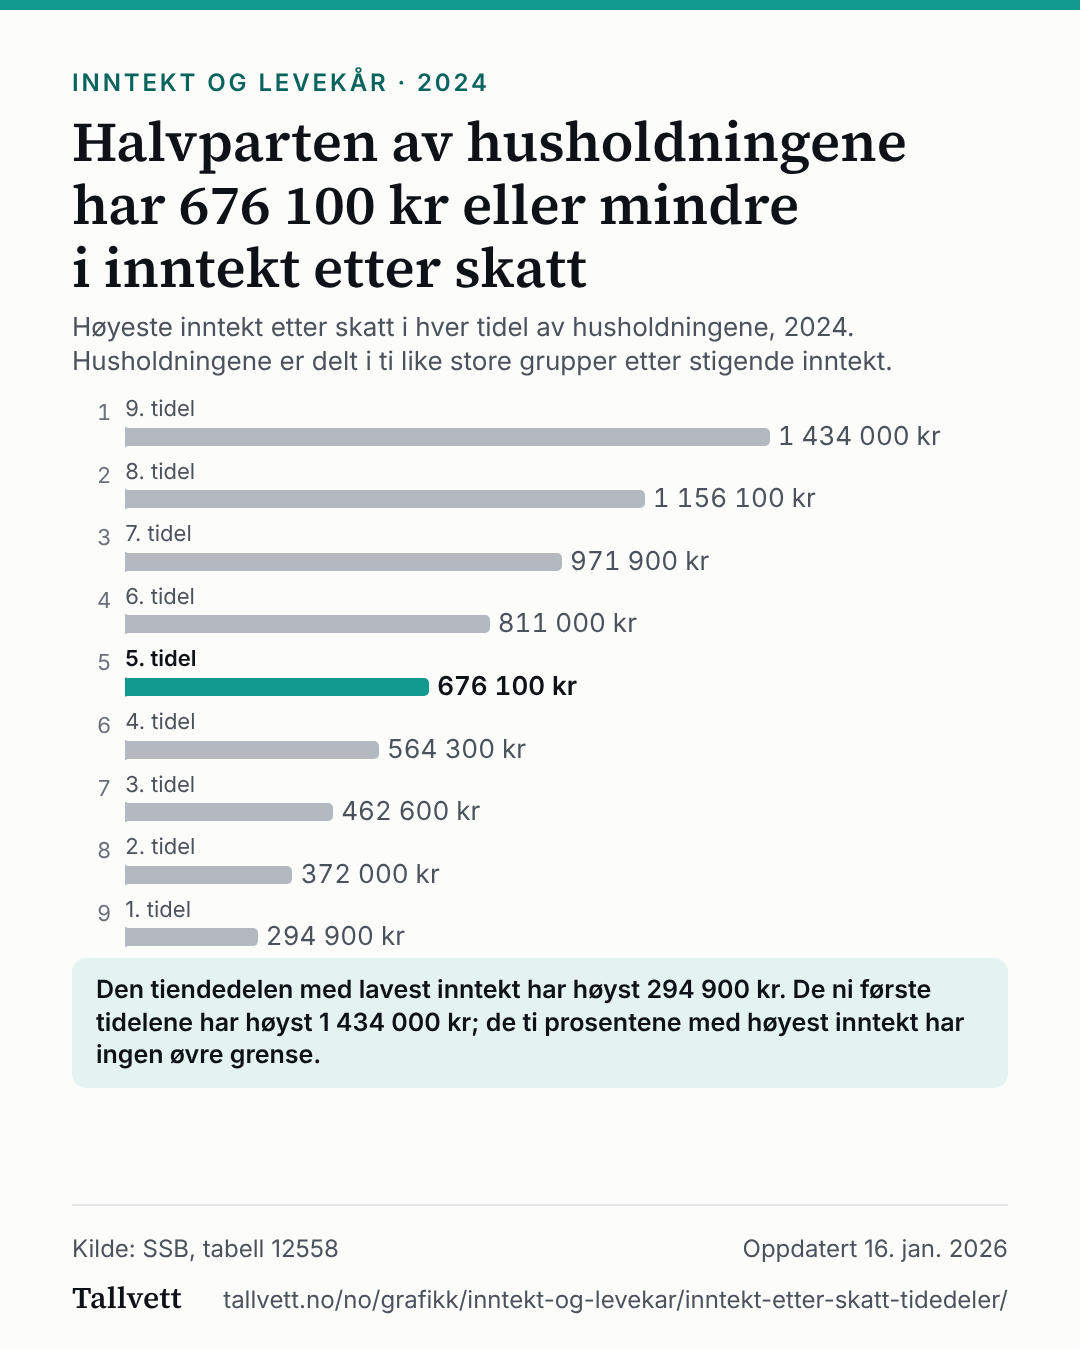
Ranked list of the highest income after tax in each of the first nine tenths (deciles) of households in 2024. 1. Tenth 9: NOK 1,434,000; 2. Tenth 8: NOK 1,156,100; 3. Tenth 7: NOK 971,900; 4. Tenth 6: NOK 811,000; 5. Tenth 5: NOK 676,100; 6. Tenth 4: NOK 564,300; 7. Tenth 3: NOK 462,600; 8. Tenth 2: NOK 372,000; 9. Tenth 1: NOK 294,900.
- Tenth 9NOK 1,434,000
- Tenth 8NOK 1,156,100
- Tenth 7NOK 971,900
- Tenth 6NOK 811,000
- Tenth 5NOK 676,100
- Tenth 4NOK 564,300
- Tenth 3NOK 462,600
- Tenth 2NOK 372,000
- Tenth 1NOK 294,900
The tenth with the lowest income has at most NOK 294,900. The first nine tenths have at most NOK 1,434,000; the ten per cent with the highest income have no upper limit.
Show the figures as a table
| Tenth of households | Highest income after tax |
|---|---|
| 1. Tenth 9 | NOK 1,434,000 |
| 2. Tenth 8 | NOK 1,156,100 |
| 3. Tenth 7 | NOK 971,900 |
| 4. Tenth 6 | NOK 811,000 |
| 5. Tenth 5 | NOK 676,100 |
| 6. Tenth 4 | NOK 564,300 |
| 7. Tenth 3 | NOK 462,600 |
| 8. Tenth 2 | NOK 372,000 |
| 9. Tenth 1 | NOK 294,900 |
How this chart was made
- The figures are Statistics Norway's own, from table 12558: the highest value in each decile of household income after tax, for the whole country. We have not calculated them.
- Households are split into ten equally large groups by rising income. The 5th tenth has the highest income that half of households are at or below.
- The 10th tenth has no upper limit, and Statistics Norway publishes no value for it.
- Household income is not adjusted for how many people live in the household. Student households and children under 18 living alone are excluded.
Statistics Norway's notes on the table
- Student households and children below the age of 18 years who are living alone, are excluded.
- The deciles group all households in Norway into 10 equally large groups by rising income. The highest value in each decile is thus the same across different geographical distributions.
- : = Confidential. Figures are not published so as to avoid identifying persons or companies.