Figures from SSB, explained with charts
Norway's numbers, explained
Charts and short explanations built on figures from Statistics Norway (SSB), in Norwegian and English. Every chart shows its source and table number and can be embedded on other sites.
25 charts in 9 categories and 3 stories
Charts
One fact per chart. Every chart can be embedded on other sites, or shared with a credit.
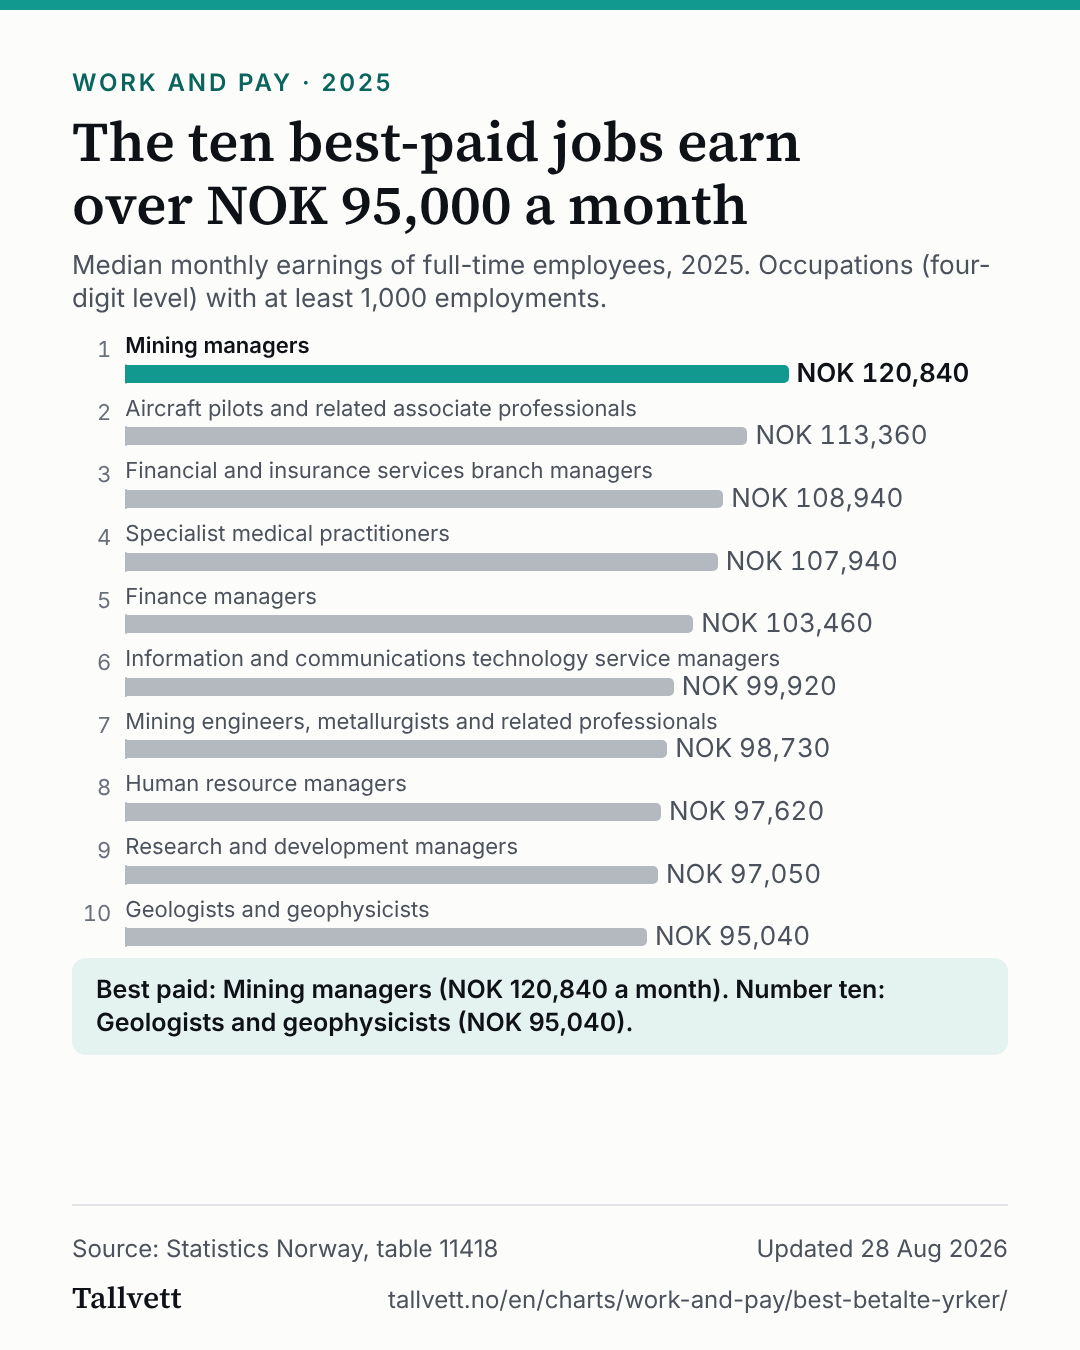 The ten best-paid jobs earn over NOK 95,000 a month
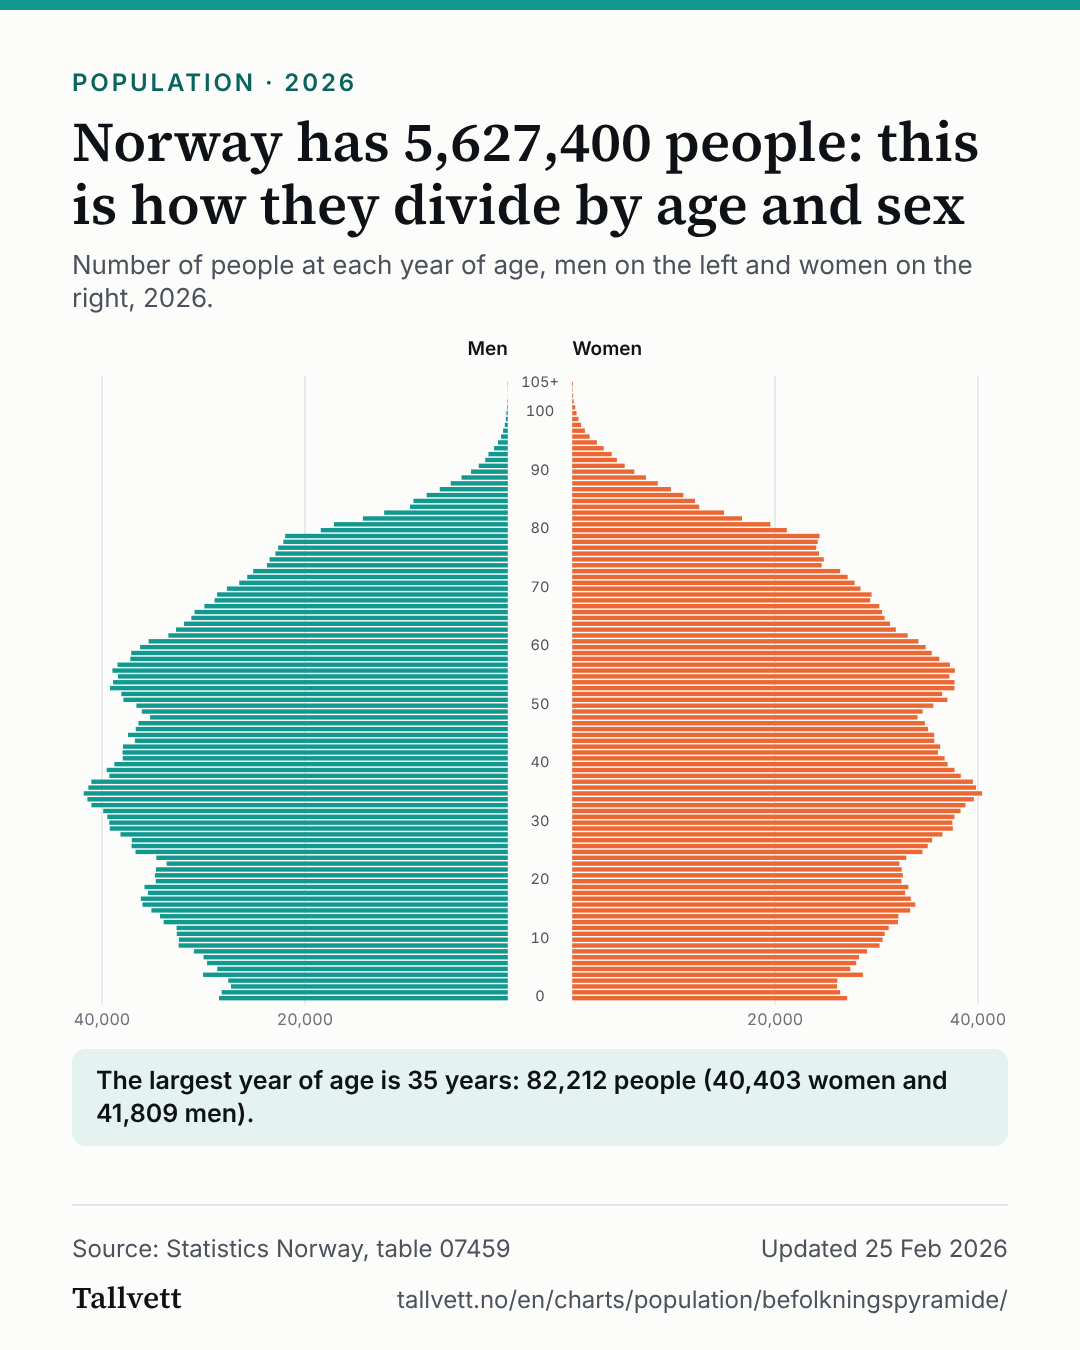 Norway has 5,627,400 people: this is how they divide by age and sex
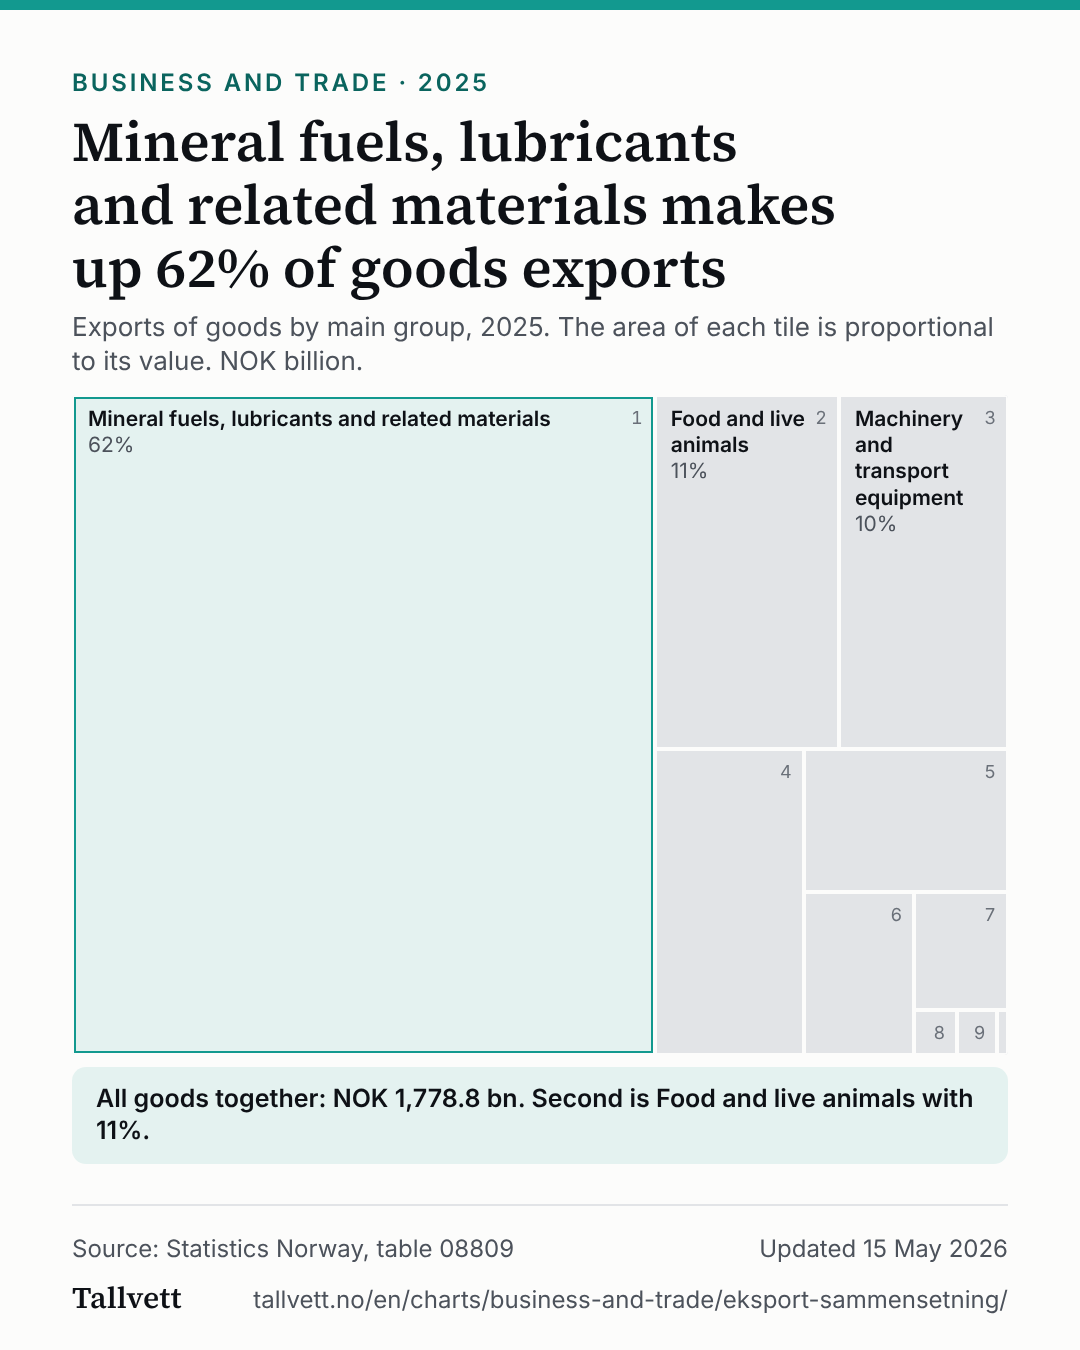 Mineral fuels, lubricants and related materials makes up 62% of goods exports
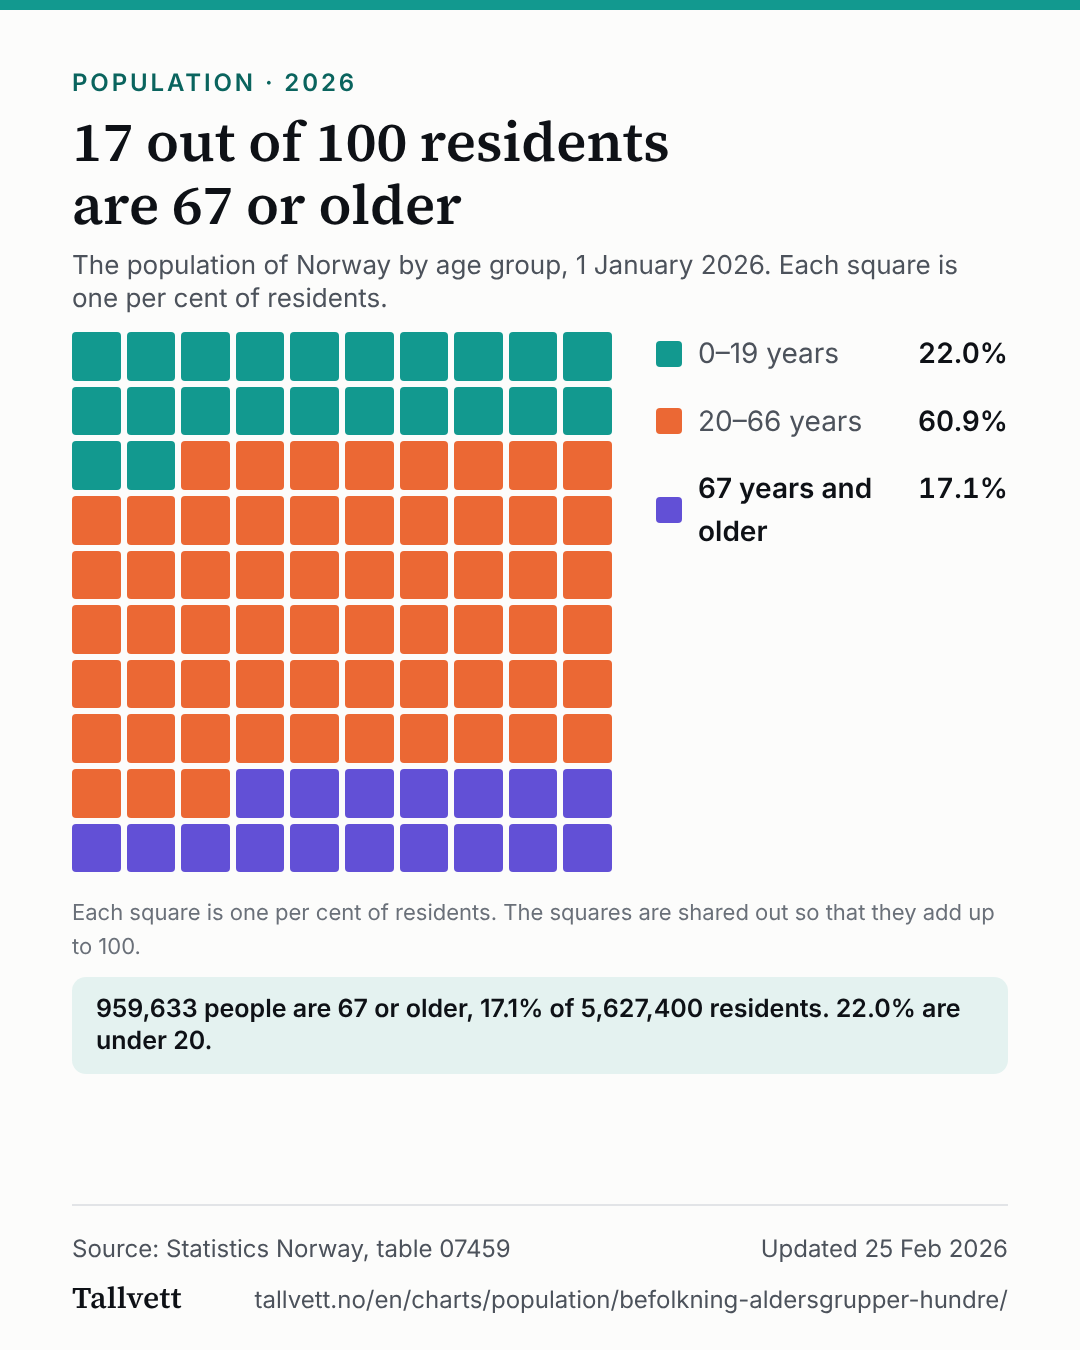 17 out of 100 residents are 67 or older
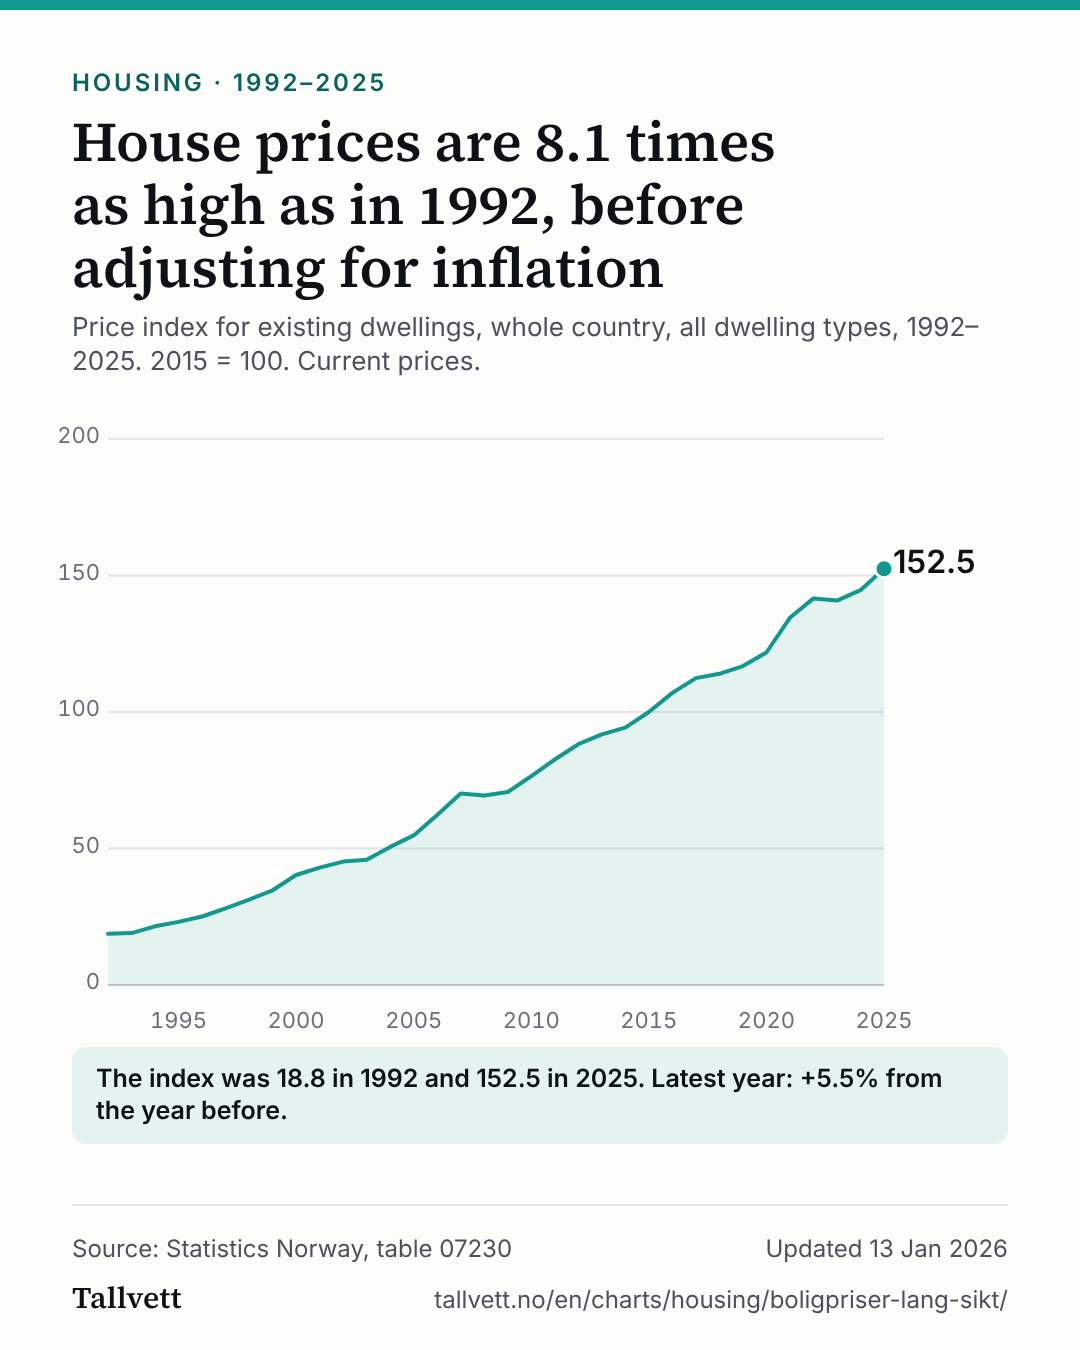 House prices are 8.1 times as high as in 1992, before adjusting for inflation
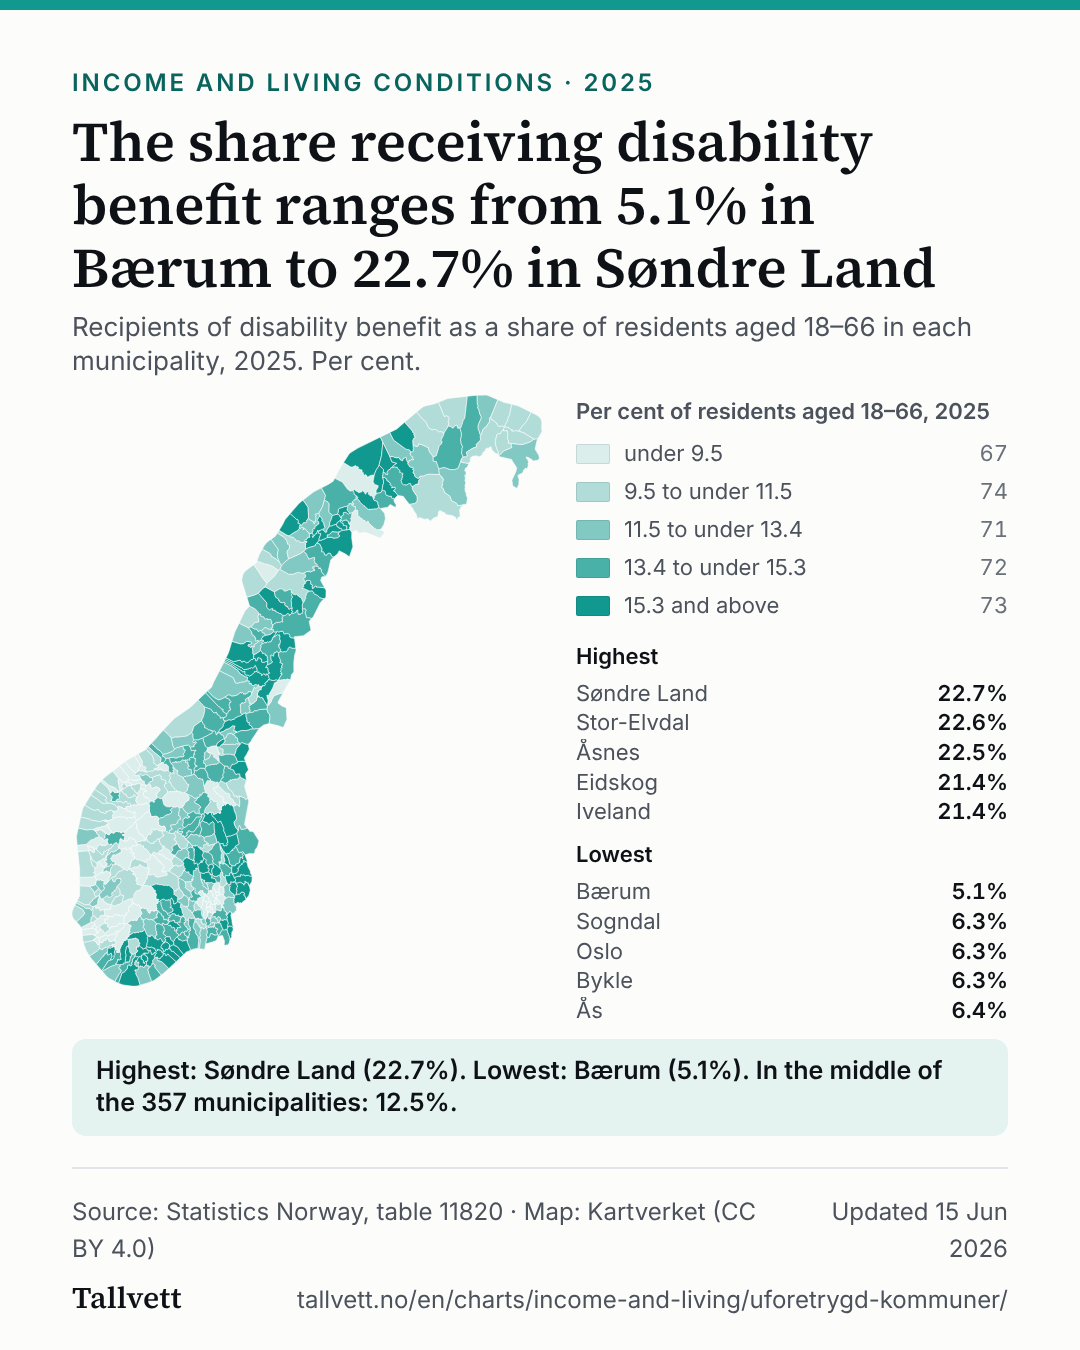 The share receiving disability benefit ranges from 5.1% in Bærum to 22.7% in Søndre Land
Pick a topic
- PopulationWho lives in Norway, and where.9 charts
- Work and payWhat people earn, and in which jobs.2 charts
- HousingWhat it costs to live.2 charts
- Prices and energyPrices, electricity and the bill.2 charts
- Income and living conditionsHow the money is shared.2 charts
- Business and tradeWhat Norway lives on.3 charts
- Municipal financesWhat municipalities collect and owe.2 charts
- EducationWhat people study and learn.2 charts
- Nature and environmentClimate, emissions and nature.1 chart
Stories
Prices
Prices are up 3.6% on a year agoPrices in October were 3.6% higher than in the same month a year earlier. That is up from 3.4% in September. Price growth is above the inflation target of 2 per cent.
Pay and prices
Pay buys 0.8% more than a year agoAverage monthly earnings in Q3 2026 were 4.1% higher than in the same quarter a year earlier, while prices rose 3.2%. Real wage growth is down from 0.9% in Q2 2026. Pay has grown faster than prices.
Housing
House prices are up 3.3% on a year agoHouse prices in Q3 2026 were 3.3% higher than in the same quarter a year earlier. Rents in October 2026 were 3.9% higher than in the same month a year earlier. That is faster than prices overall, which rose 3.6% over the same period.
Why you can trust the figures
- Source and method
All figures come from Statistics Norway and carry their table number. What we calculate ourselves is stated under each chart.
- Corrections
If we make an error, we fix it and list it on a page of its own, for good.
- Who is behind it
An independent team with a background in data analysis and visualisation. Not a service of Statistics Norway.
- Embed the charts
Every chart can be embedded on your site, with credit. They use no cookies.