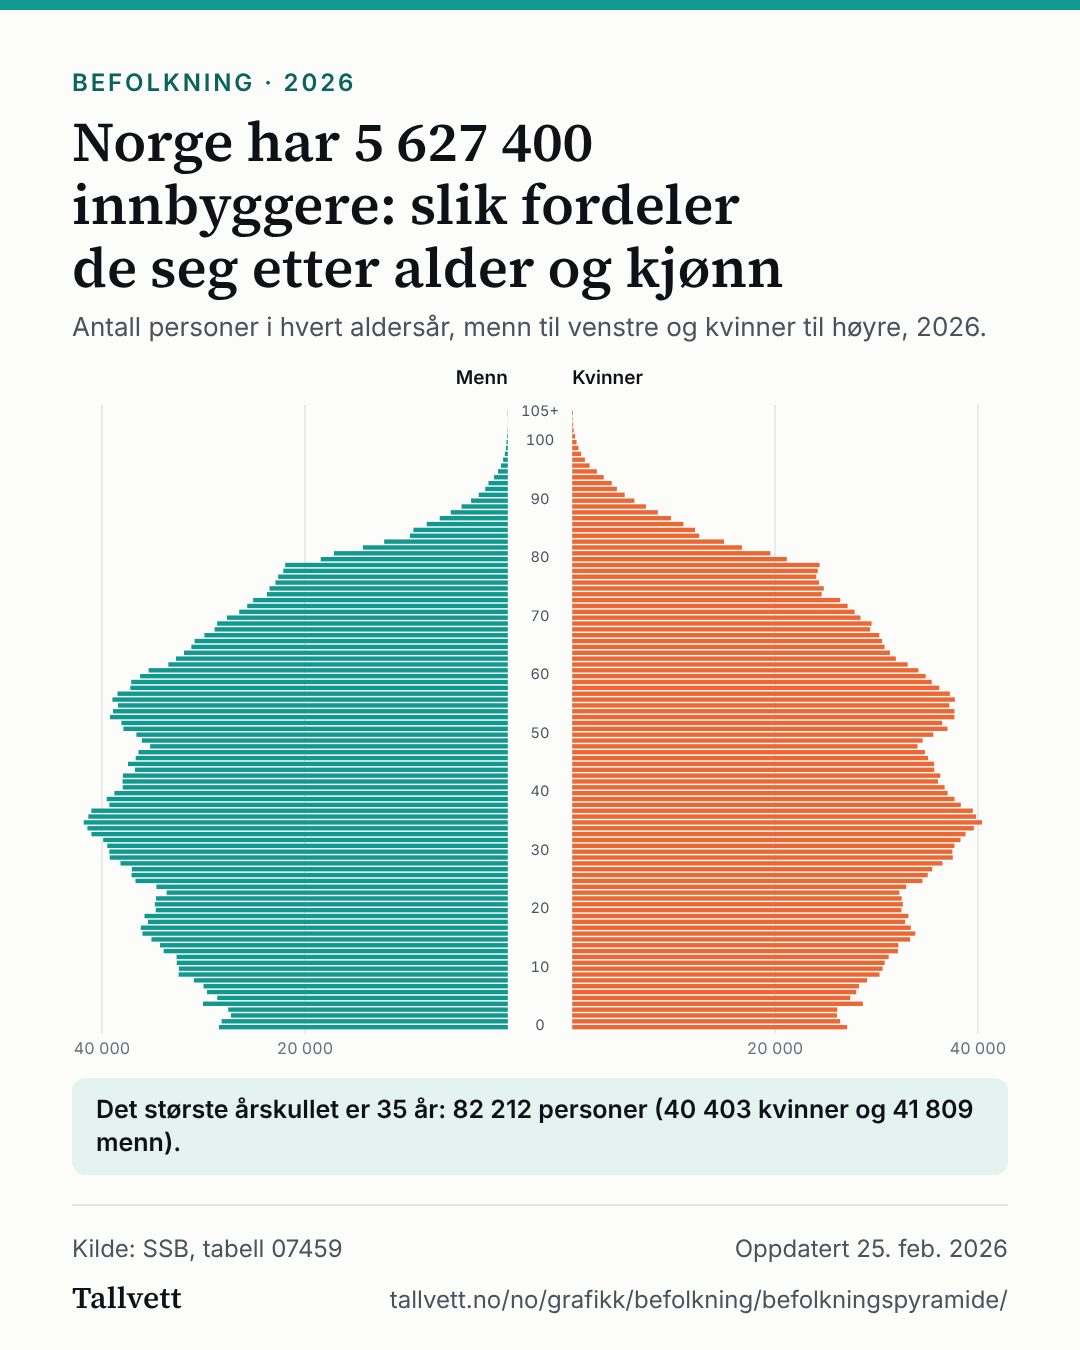
Norway has 5,627,400 people: this is how they divide by age and sex
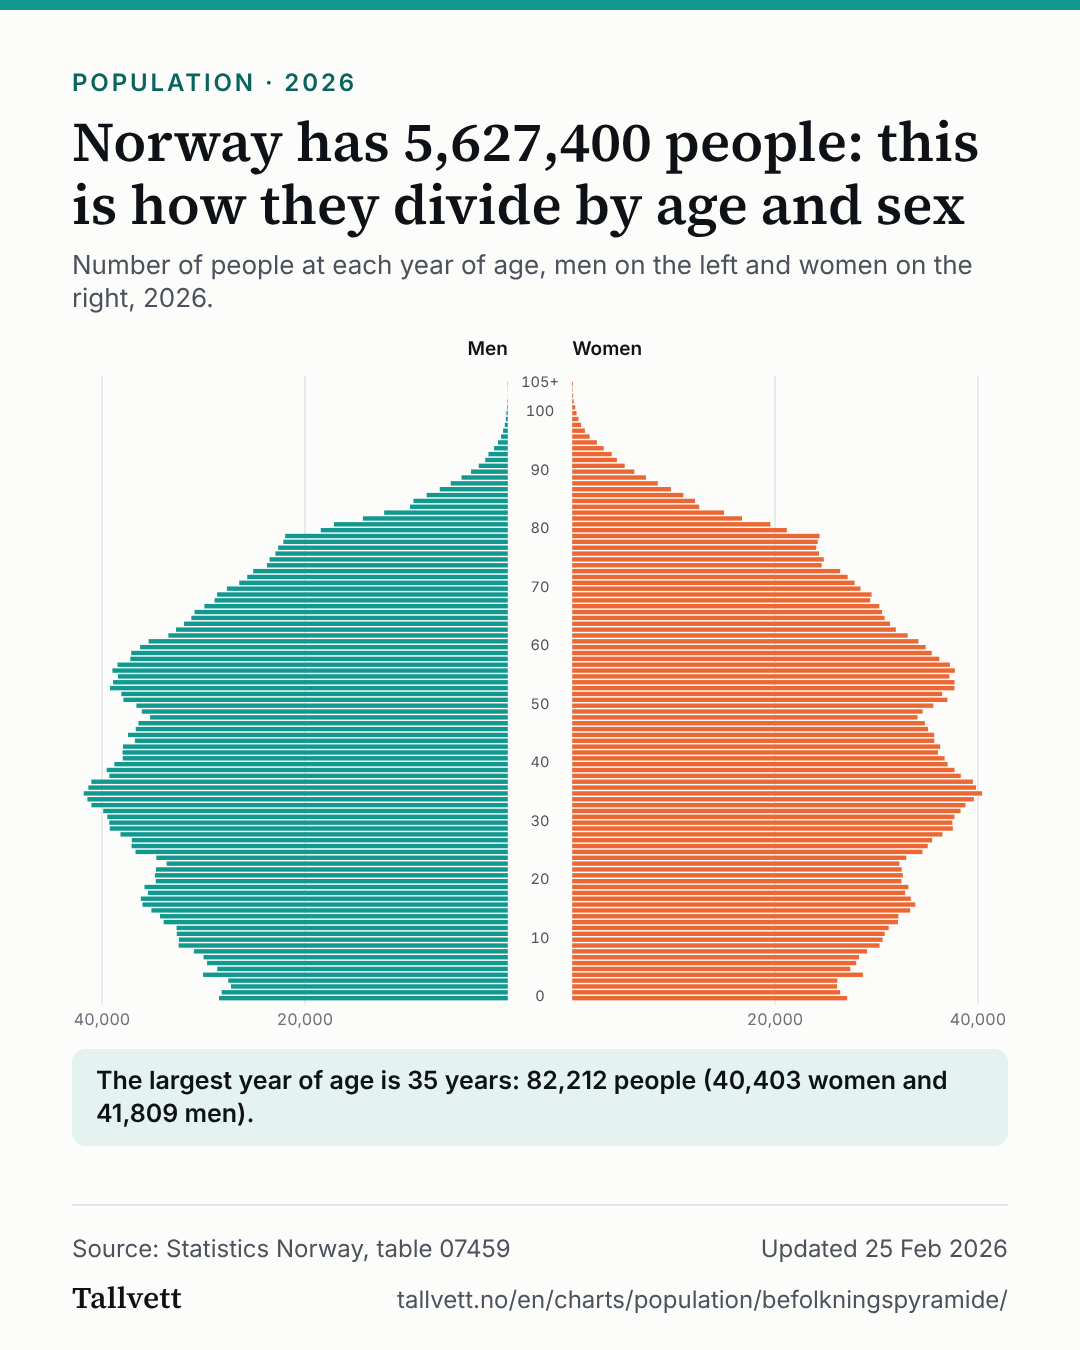
Norway has 5,627,400 people: this is how they divide by age and sex
Number of people at each year of age, men on the left and women on the right, 2026.
Population pyramid for Norway in 2026: the number of men and women at each year of age, from 0 years to 105 years or older. In all, 5,627,400 people live in Norway. The largest year of age is 35 years: 82,212 people (40,403 women and 41,809 men).
The largest year of age is 35 years: 82,212 people (40,403 women and 41,809 men).
Show the figures as a table
| Age | Men | Women |
|---|---|---|
| 0 years | 28,471 | 27,107 |
| 1 year | 28,214 | 26,420 |
| 2 years | 27,286 | 26,100 |
| 3 years | 27,560 | 26,140 |
| 4 years | 30,044 | 28,658 |
| 5 years | 28,642 | 27,411 |
| 6 years | 29,649 | 28,004 |
| 7 years | 29,997 | 28,268 |
| 8 years | 30,947 | 29,065 |
| 9 years | 32,451 | 30,298 |
| 10 years | 32,425 | 30,600 |
| 11 years | 32,635 | 30,807 |
| 12 years | 32,654 | 31,201 |
| 13 years | 33,926 | 32,112 |
| 14 years | 34,284 | 32,154 |
| 15 years | 35,134 | 33,320 |
| 16 years | 36,012 | 33,825 |
| 17 years | 36,176 | 33,383 |
| 18 years | 35,478 | 32,816 |
| 19 years | 35,814 | 33,146 |
| 20 years | 34,702 | 32,460 |
| 21 years | 34,794 | 32,602 |
| 22 years | 34,689 | 32,482 |
| 23 years | 33,635 | 32,251 |
| 24 years | 34,648 | 32,932 |
| 25 years | 36,704 | 34,531 |
| 26 years | 37,090 | 35,048 |
| 27 years | 37,063 | 35,490 |
| 28 years | 38,184 | 36,502 |
| 29 years | 39,242 | 37,522 |
| 30 years | 39,284 | 37,478 |
| 31 years | 39,480 | 37,682 |
| 32 years | 39,886 | 38,282 |
| 33 years | 41,048 | 38,775 |
| 34 years | 41,443 | 39,595 |
| 35 years | 41,809 | 40,403 |
| 36 years | 41,351 | 39,815 |
| 37 years | 41,052 | 39,496 |
| 38 years | 39,279 | 38,309 |
| 39 years | 39,540 | 37,694 |
| 40 years | 38,788 | 37,009 |
| 41 years | 37,962 | 36,714 |
| 42 years | 37,981 | 36,058 |
| 43 years | 37,941 | 36,287 |
| 44 years | 36,760 | 35,701 |
| 45 years | 37,442 | 35,685 |
| 46 years | 36,683 | 35,090 |
| 47 years | 36,413 | 34,771 |
| 48 years | 35,260 | 34,045 |
| 49 years | 36,080 | 34,543 |
| 50 years | 36,616 | 35,605 |
| 51 years | 37,896 | 36,990 |
| 52 years | 38,094 | 36,470 |
| 53 years | 39,216 | 37,682 |
| 54 years | 38,914 | 37,693 |
| 55 years | 38,430 | 37,179 |
| 56 years | 38,979 | 37,728 |
| 57 years | 38,480 | 37,230 |
| 58 years | 37,215 | 36,186 |
| 59 years | 37,126 | 35,444 |
| 60 years | 36,249 | 34,847 |
| 61 years | 35,413 | 34,132 |
| 62 years | 33,463 | 33,073 |
| 63 years | 32,710 | 31,907 |
| 64 years | 31,924 | 31,330 |
| 65 years | 31,199 | 30,798 |
| 66 years | 30,880 | 30,550 |
| 67 years | 29,911 | 30,273 |
| 68 years | 28,908 | 29,378 |
| 69 years | 28,657 | 29,515 |
| 70 years | 27,690 | 28,426 |
| 71 years | 26,479 | 27,841 |
| 72 years | 25,689 | 27,153 |
| 73 years | 25,102 | 26,419 |
| 74 years | 23,746 | 24,595 |
| 75 years | 23,491 | 24,805 |
| 76 years | 22,912 | 24,332 |
| 77 years | 22,641 | 24,061 |
| 78 years | 22,130 | 24,204 |
| 79 years | 21,946 | 24,390 |
| 80 years | 18,443 | 21,158 |
| 81 years | 17,145 | 19,541 |
| 82 years | 14,288 | 16,741 |
| 83 years | 12,189 | 14,973 |
| 84 years | 9,645 | 12,519 |
| 85 years | 9,305 | 12,106 |
| 86 years | 7,995 | 10,960 |
| 87 years | 6,711 | 9,737 |
| 88 years | 5,628 | 8,443 |
| 89 years | 4,560 | 7,270 |
| 90 years | 3,625 | 6,127 |
| 91 years | 2,869 | 5,176 |
| 92 years | 2,227 | 4,408 |
| 93 years | 1,908 | 3,901 |
| 94 years | 1,354 | 3,111 |
| 95 years | 970 | 2,435 |
| 96 years | 672 | 1,718 |
| 97 years | 464 | 1,252 |
| 98 years | 298 | 874 |
| 99 years | 190 | 621 |
| 100 years | 134 | 431 |
| 101 years | 68 | 294 |
| 102 years | 39 | 147 |
| 103 years | 10 | 91 |
| 104 years | 9 | 46 |
| 105 years or older | 33 | 80 |
How this chart was made
- The figures are Statistics Norway's own, from table 07459: the number of people at each year of age by sex. The total is Statistics Norway's figure for the whole country (table 07459).
- The largest year of age is the age at which men and women together are most numerous. We found it by adding men and women for each year and comparing.
- The top group is everyone aged 105 or older.
More charts about population
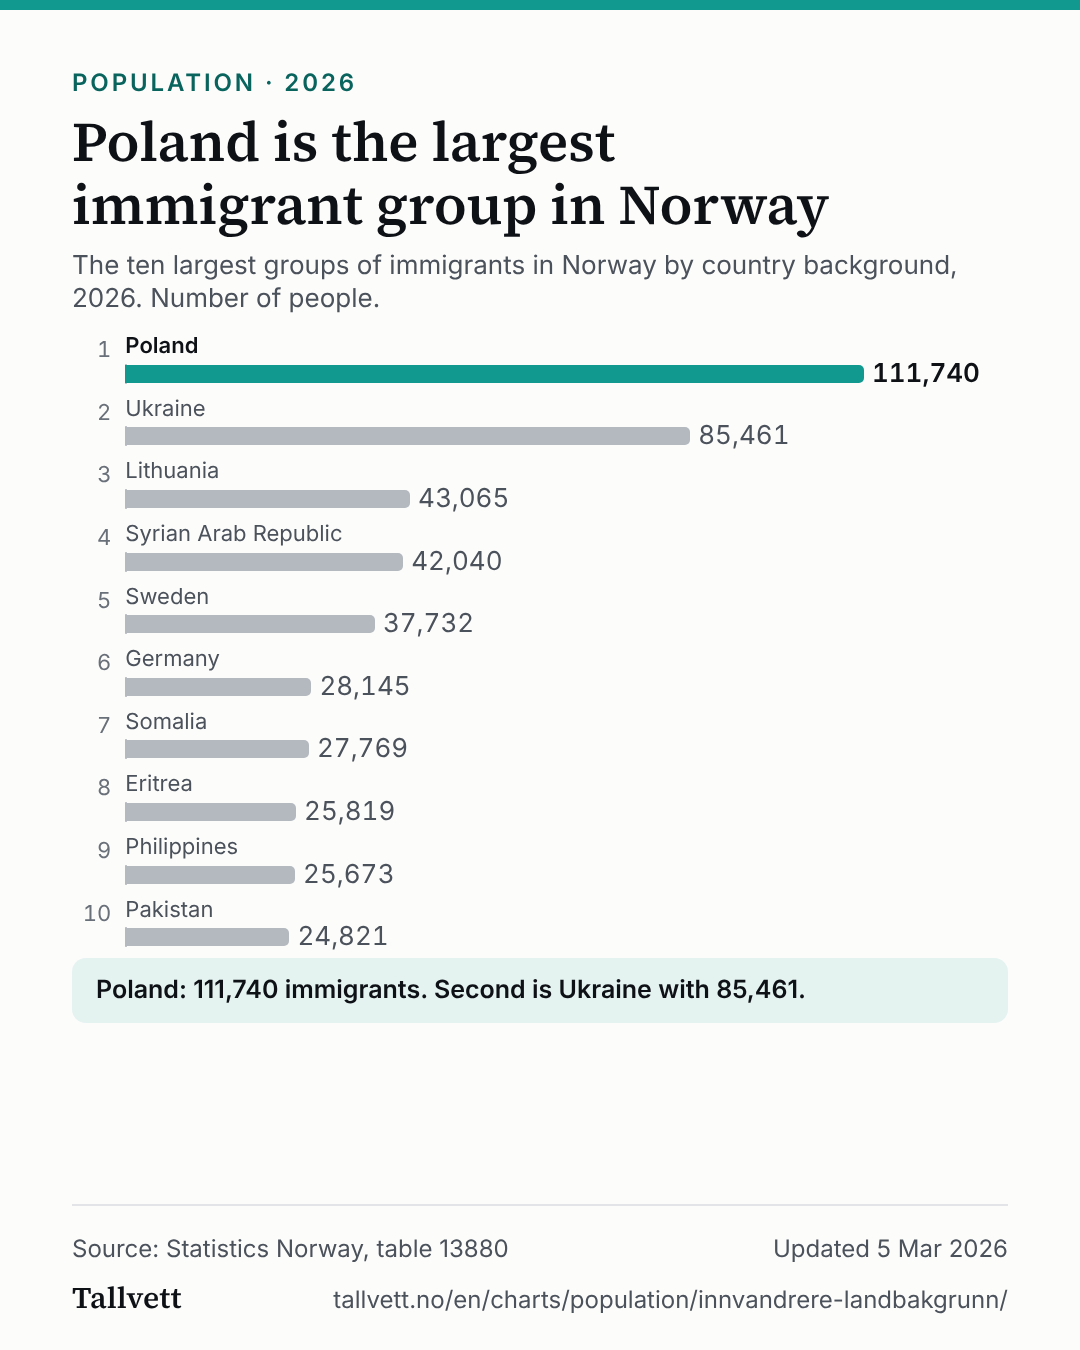 Poland is the largest immigrant group in Norway
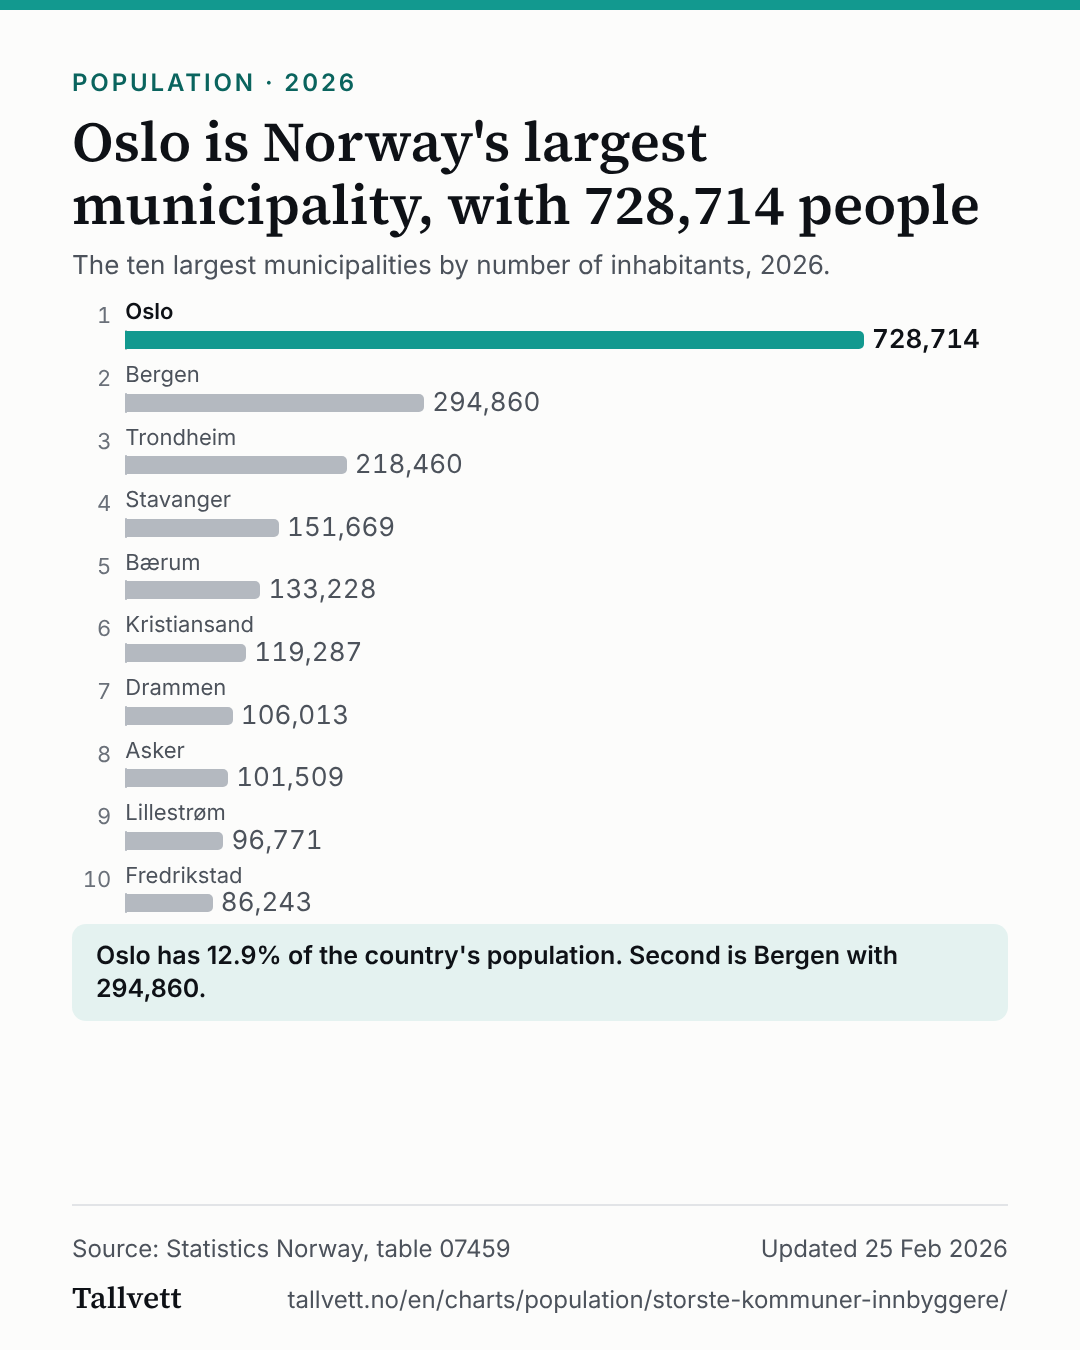 Oslo is Norway's largest municipality, with 728,714 people
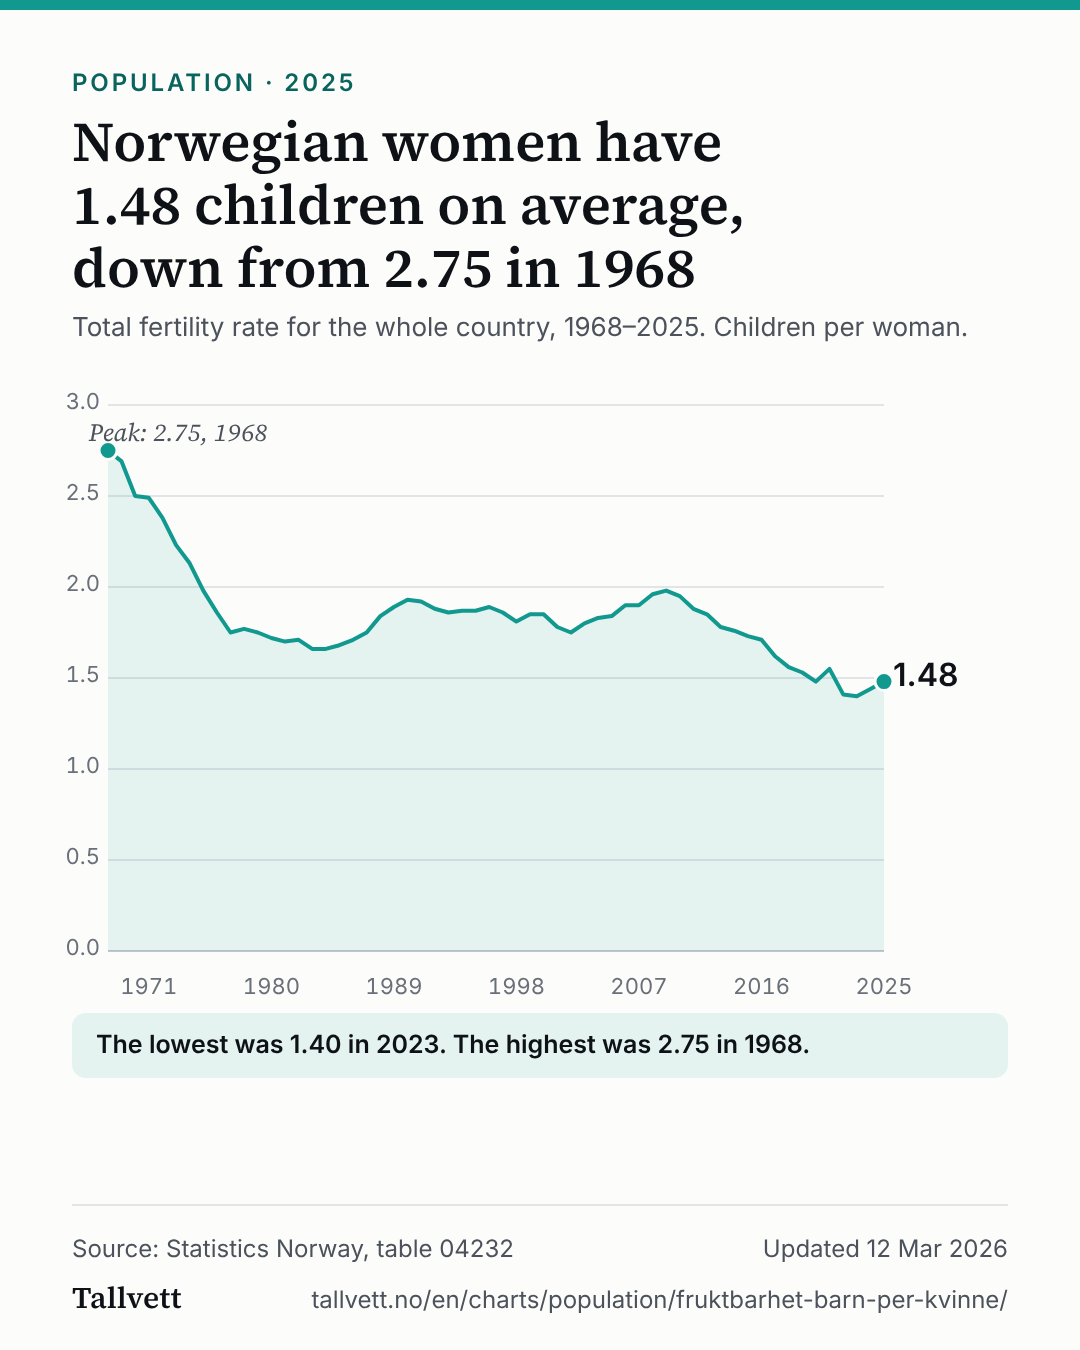 Norwegian women have 1.48 children on average, down from 2.75 in 1968
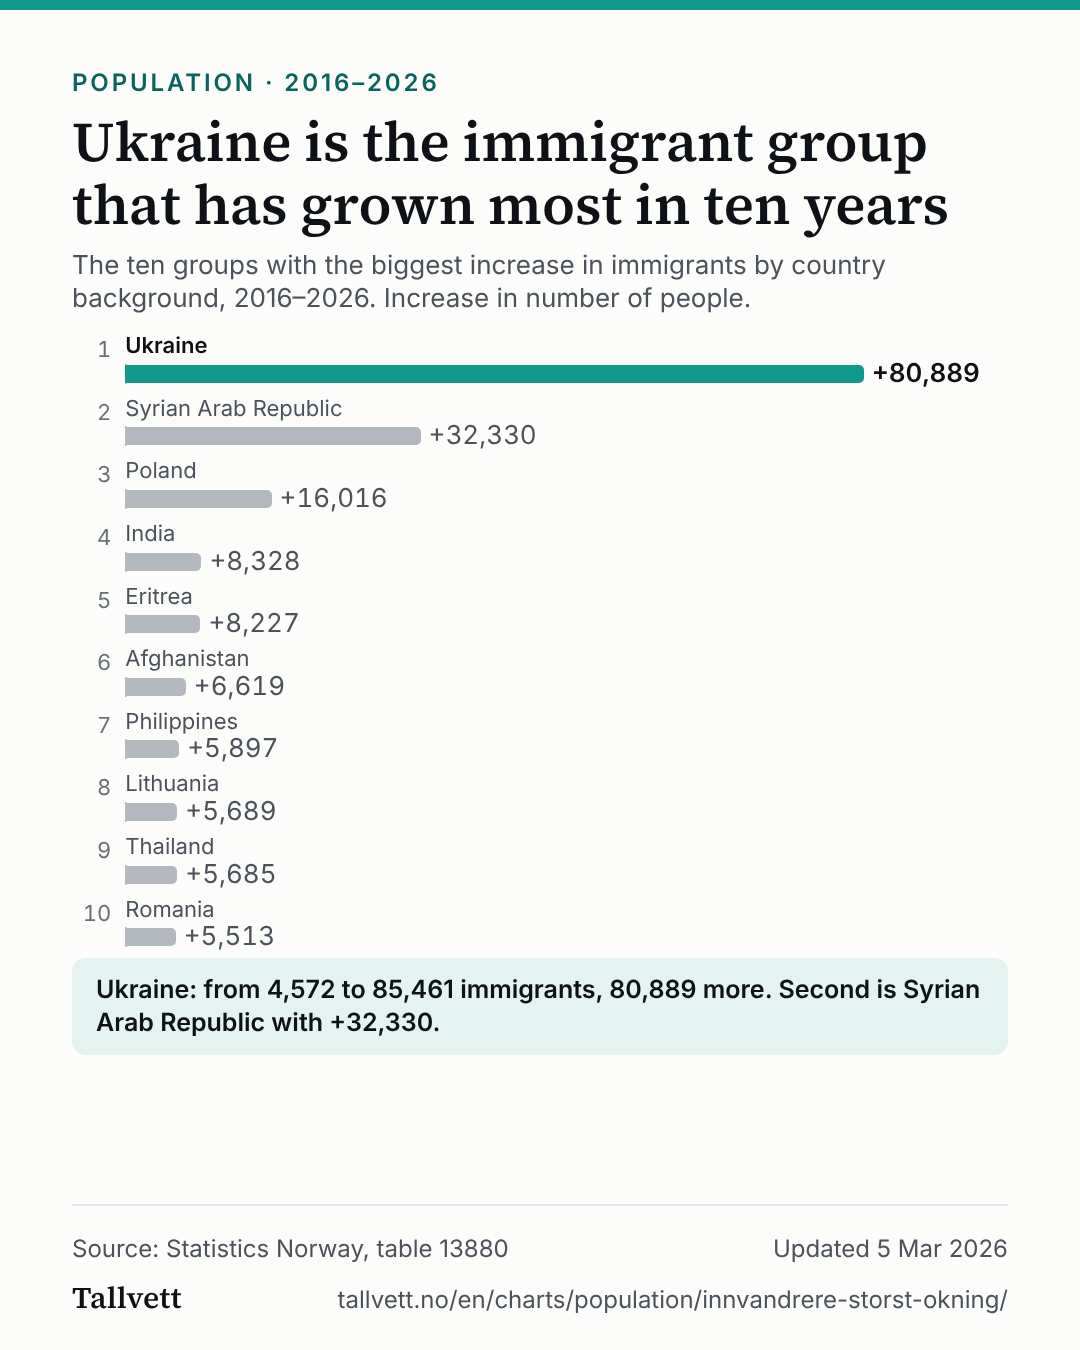 Ukraine is the immigrant group that has grown most in ten years
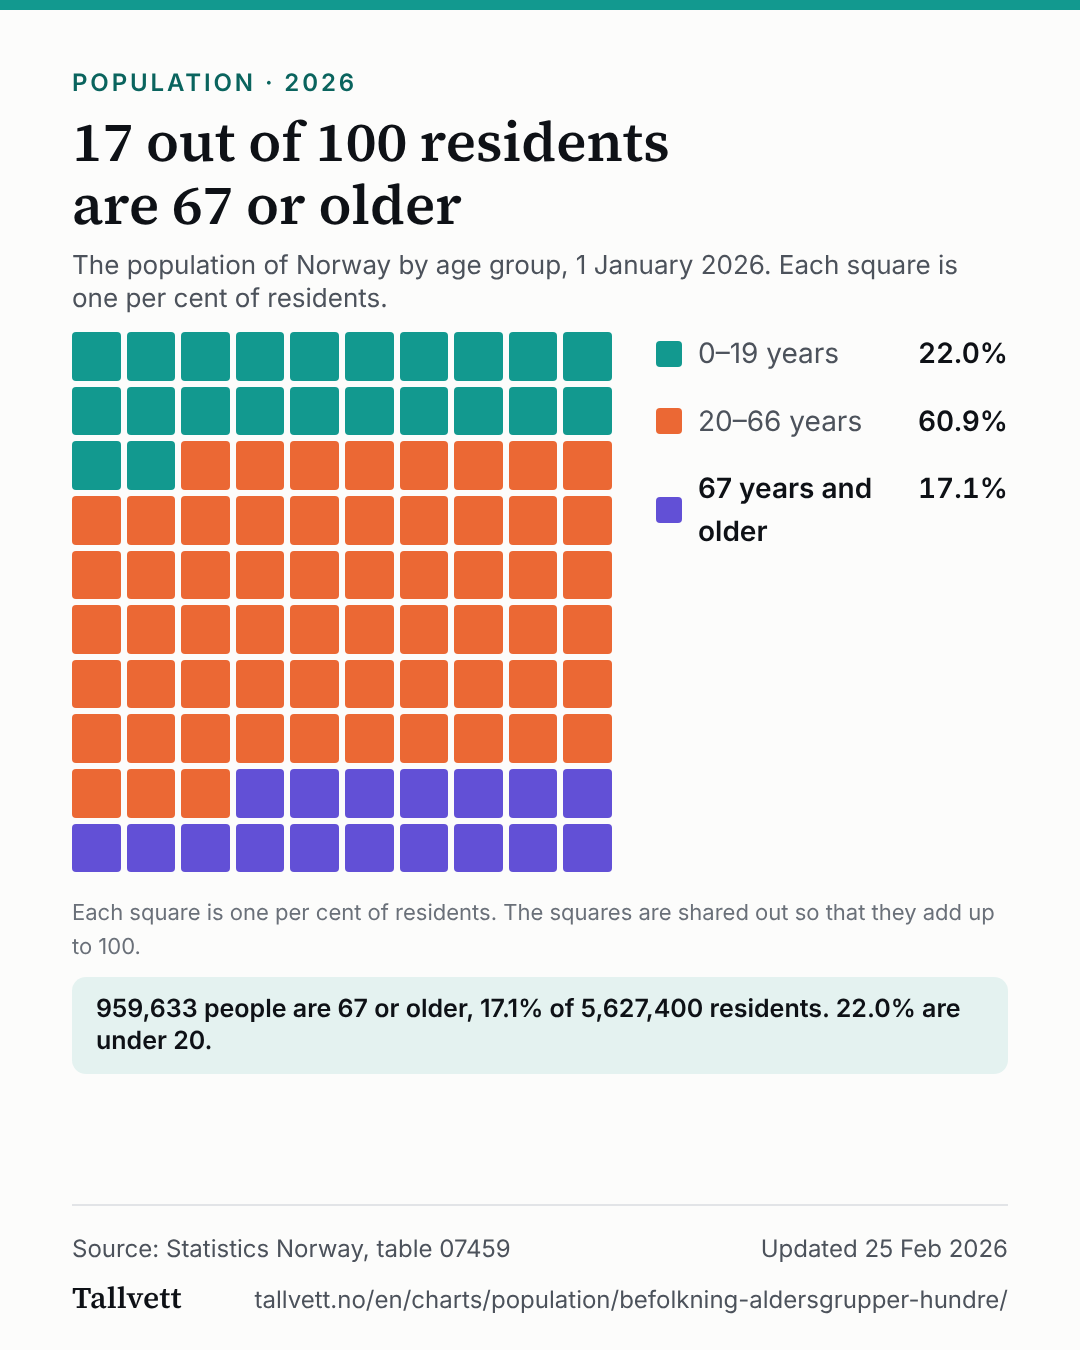 17 out of 100 residents are 67 or older
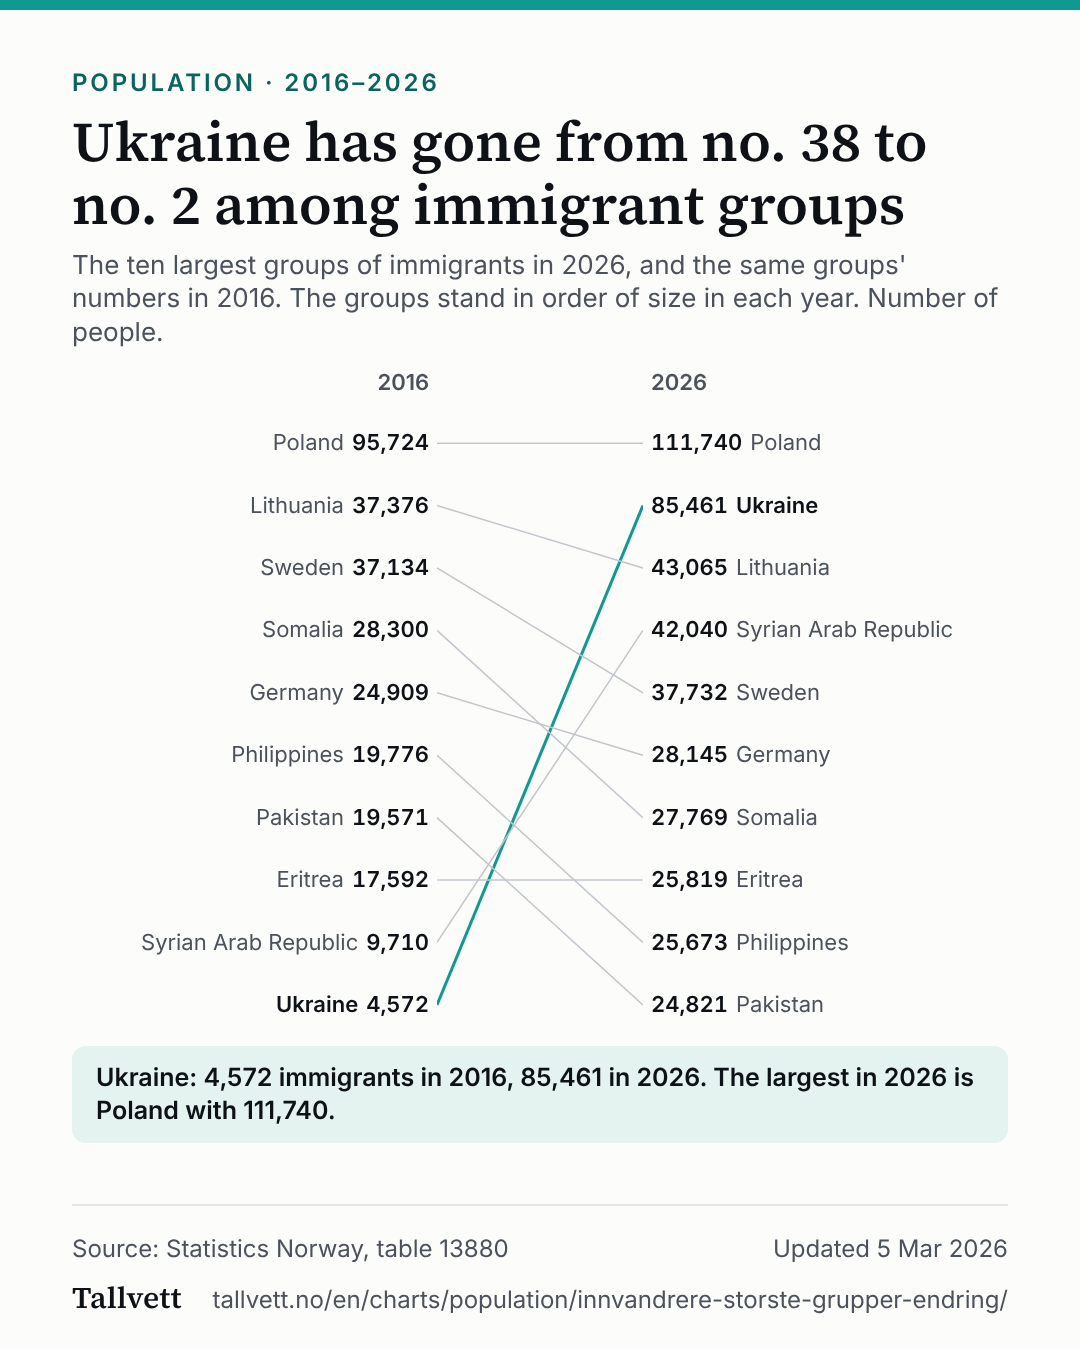 Ukraine has gone from no. 38 to no. 2 among immigrant groups
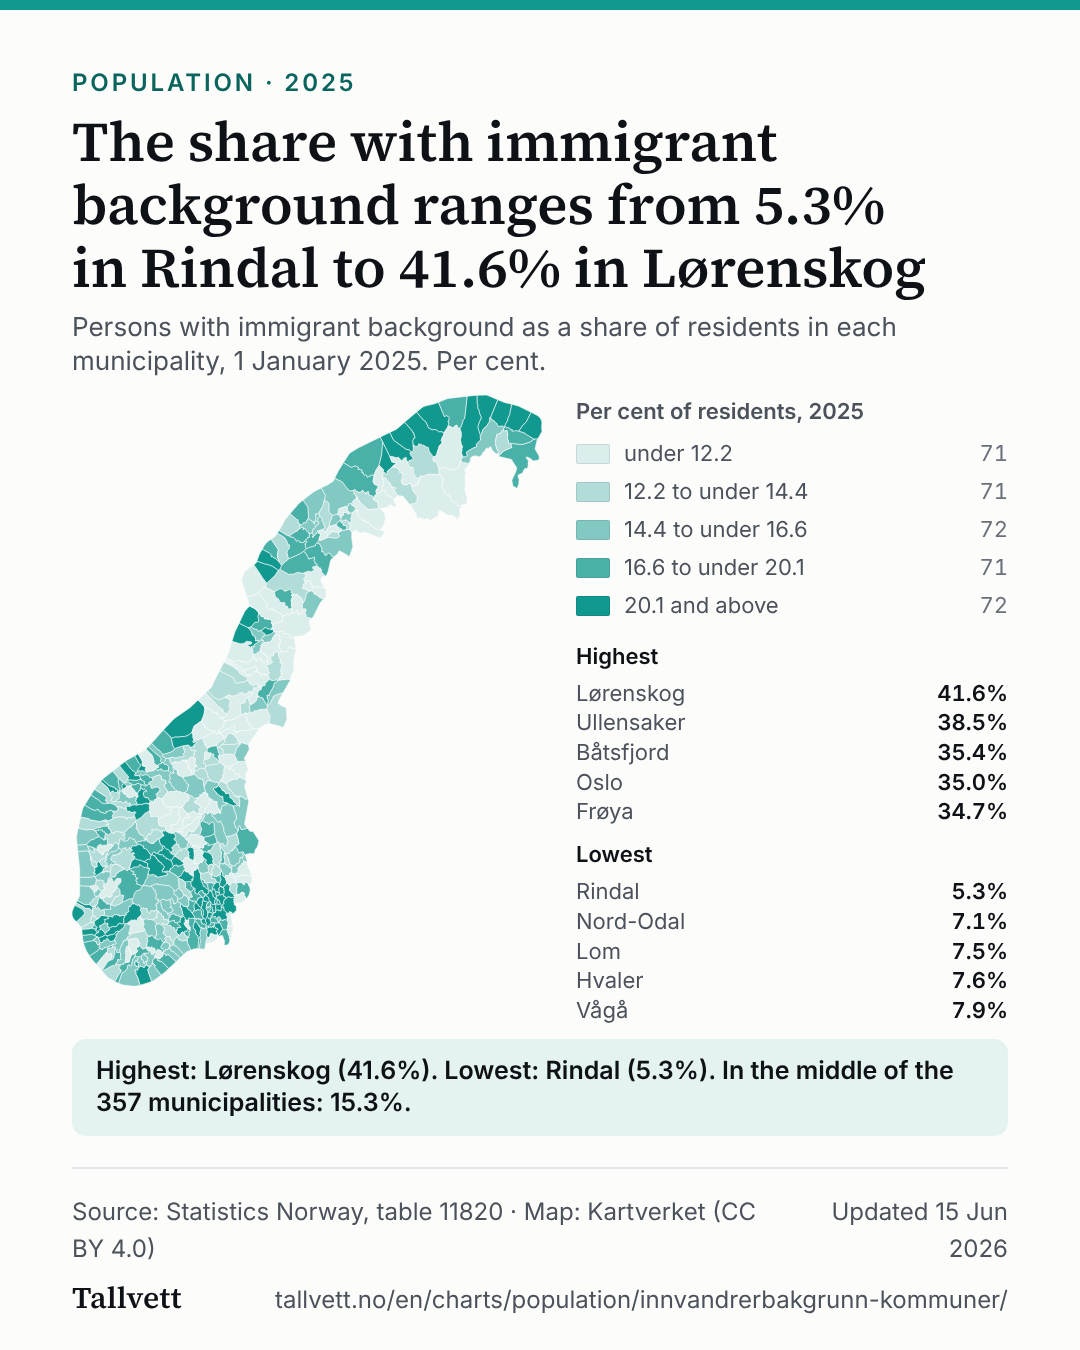 The share with immigrant background ranges from 5.3% in Rindal to 41.6% in Lørenskog
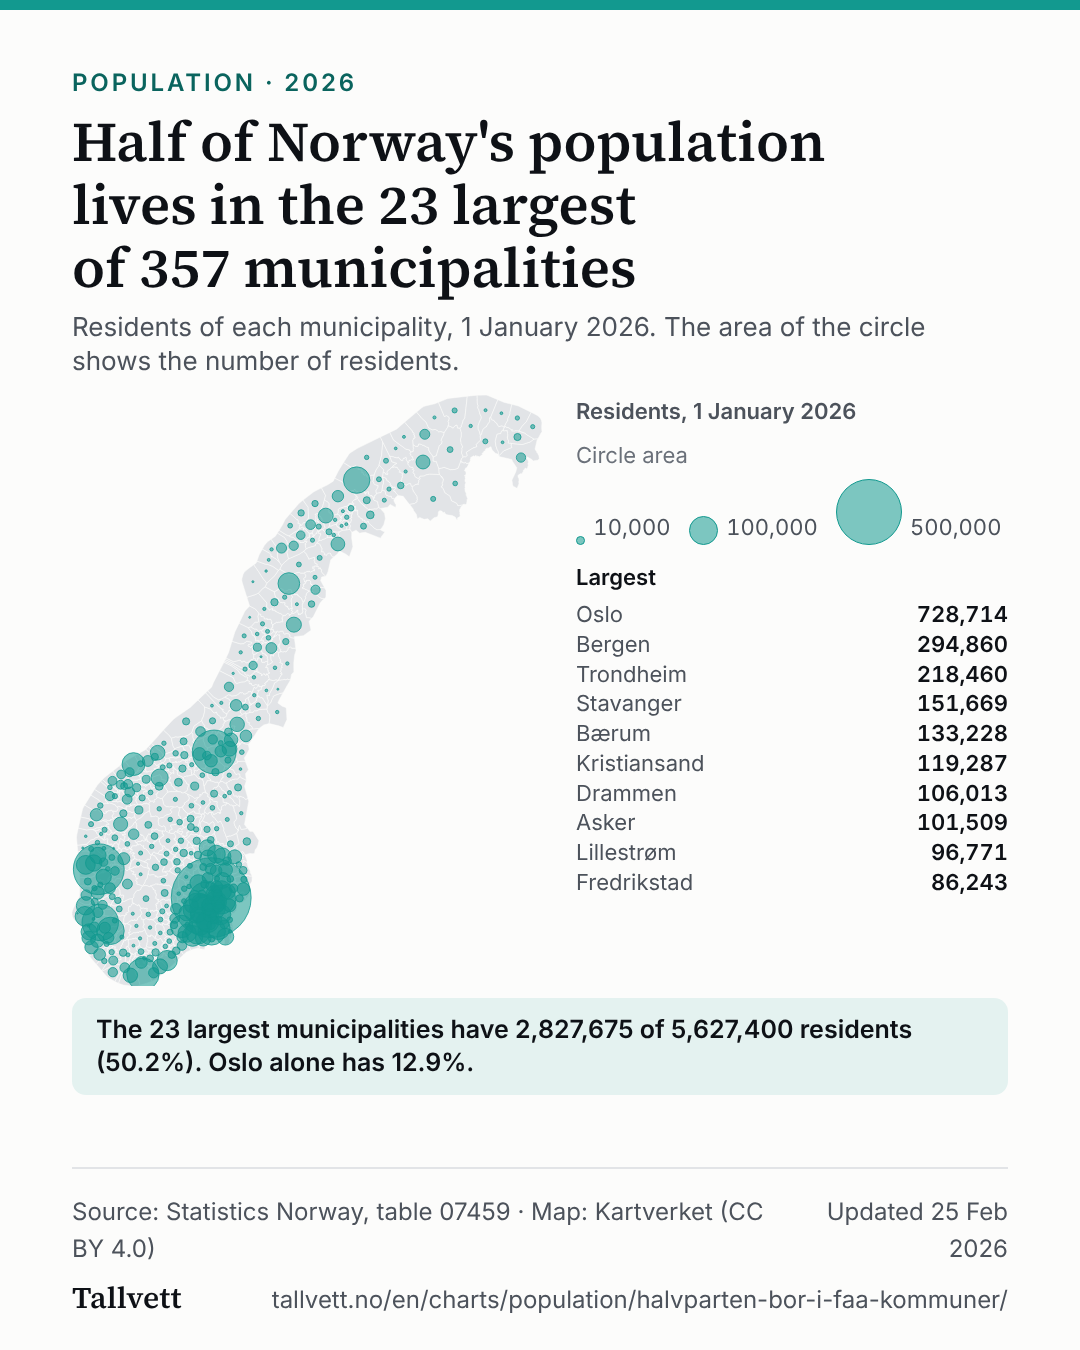 Half of Norway's population lives in the 23 largest of 357 municipalities