Housing · Updated 10 Nov 2026
House prices are up 3.3% on a year ago
House prices in Q3 2026 were 3.3% higher than in the same quarter a year earlier. Rents in October 2026 were 3.9% higher than in the same month a year earlier. That is faster than prices overall, which rose 3.6% over the same period.
House prices are up 3.3% on a year ago
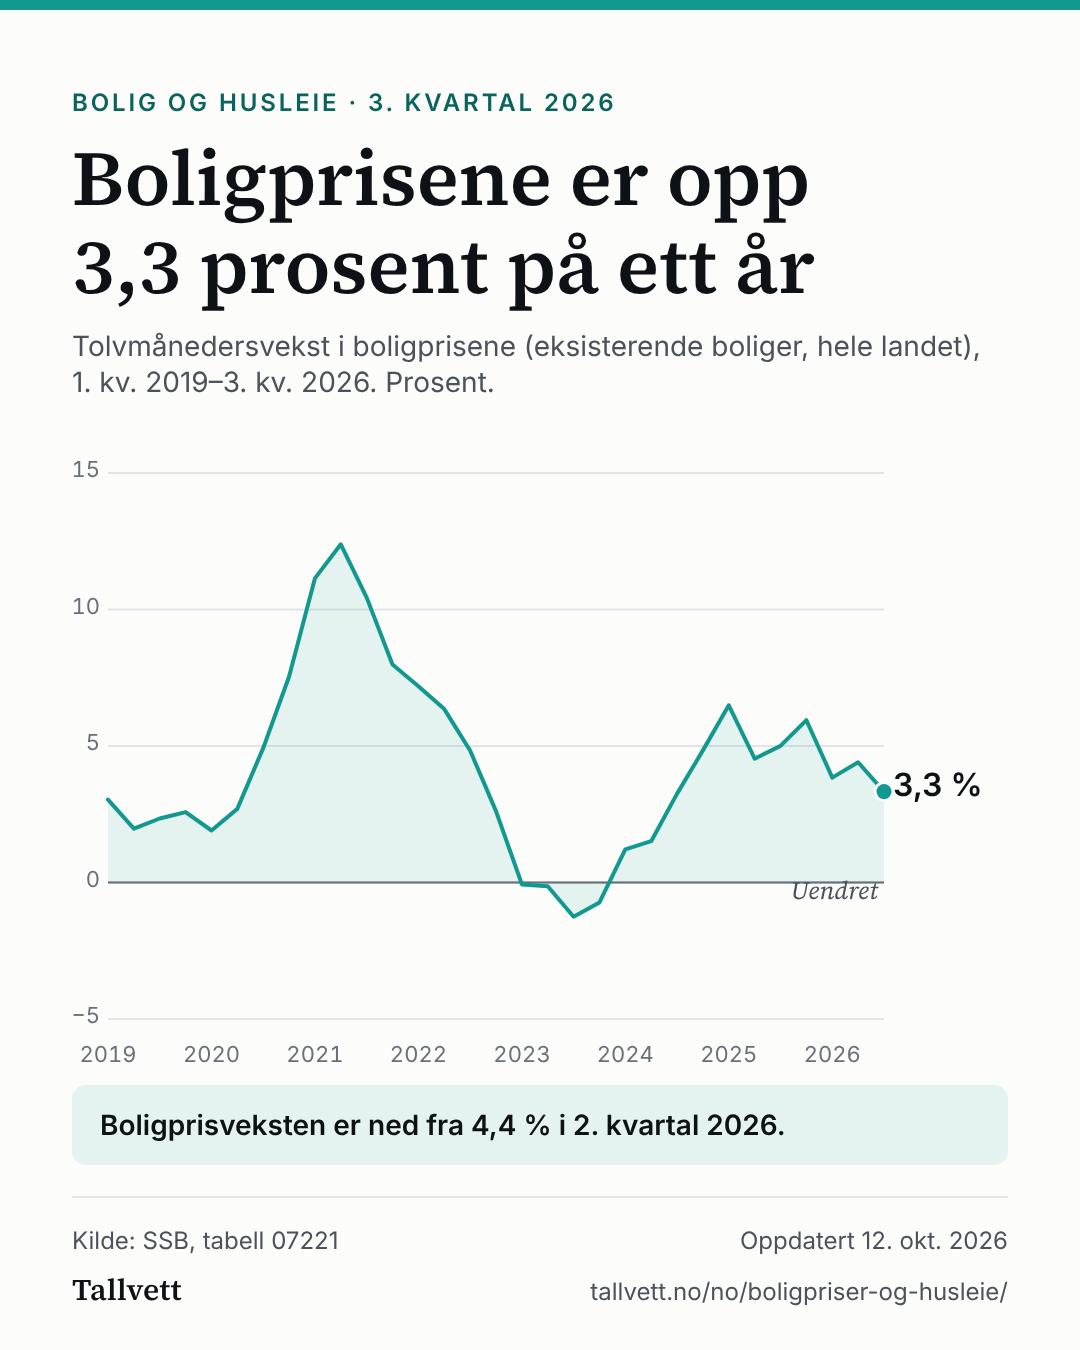
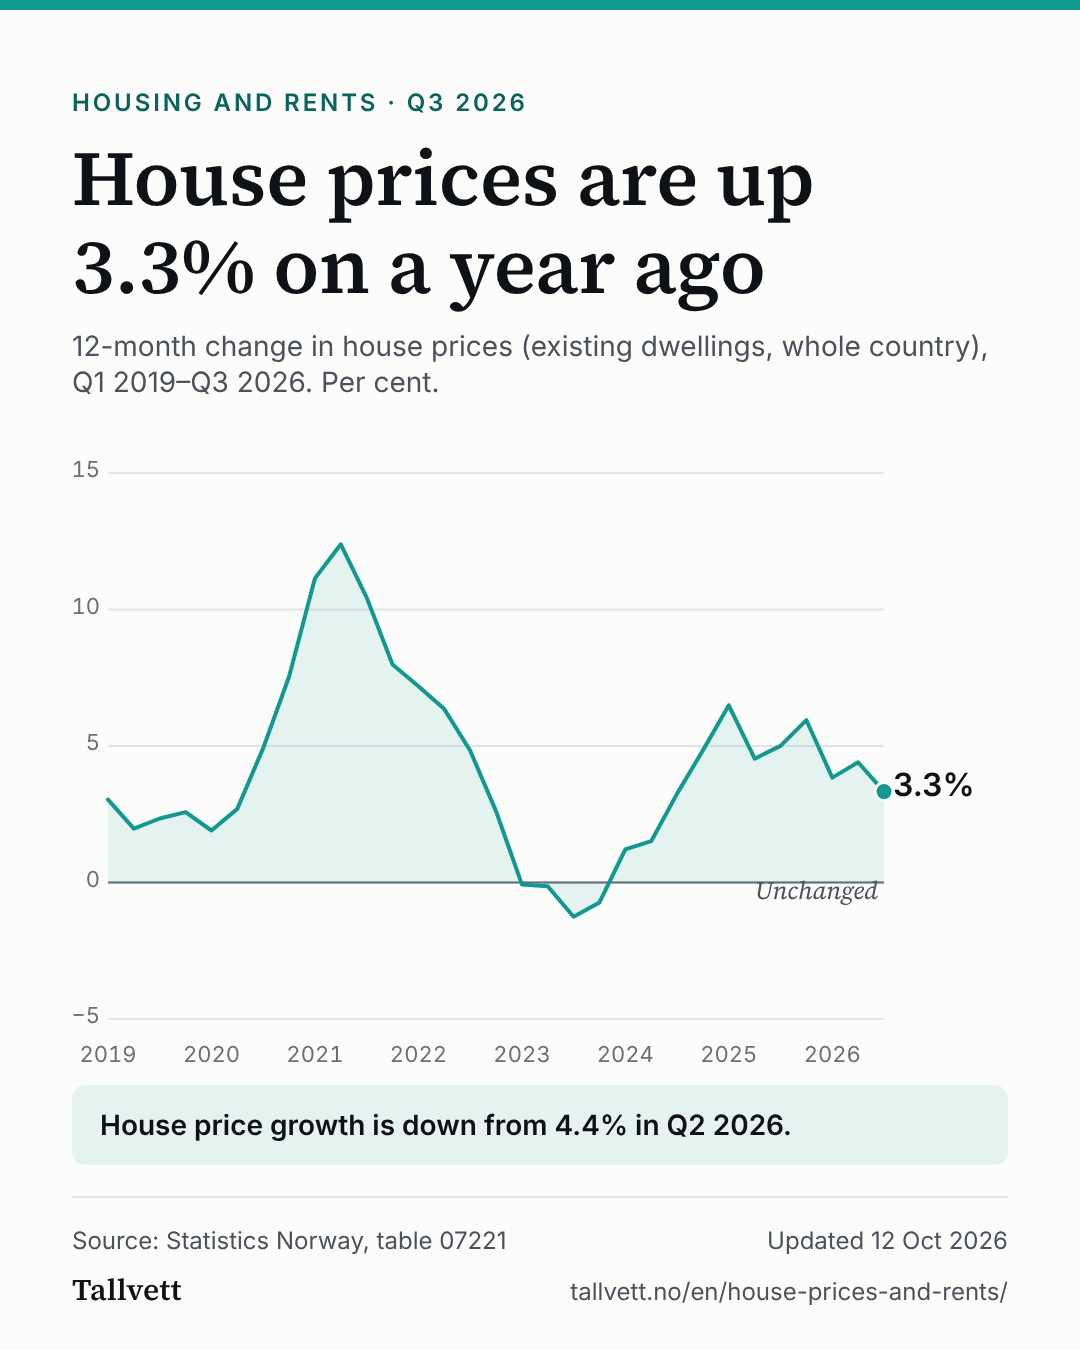
12-month change in house prices (existing dwellings, whole country), Q1 2019–Q3 2026. Per cent.
Line chart of how much house prices have changed from the same quarter a year earlier, from Q1 2019 to Q3 2026. The highest value in the period was 12.4% in Q2 2021. The latest value is 3.3%.
House price growth is down from 4.4% in Q2 2026.
Show the figures as a table
| Period | House price change |
|---|---|
| Q3 2026 | 3.3% |
| Q2 2026 | 4.4% |
| Q1 2026 | 3.8% |
| Q4 2025 | 5.9% |
| Q3 2025 | 5.0% |
| Q2 2025 | 4.5% |
| Q1 2025 | 6.5% |
| Q4 2024 | 4.8% |
| Q3 2024 | 3.3% |
| Q2 2024 | 1.5% |
| Q1 2024 | 1.2% |
| Q4 2023 | −0.7% |
| Q3 2023 | −1.3% |
| Q2 2023 | −0.1% |
| Q1 2023 | −0.1% |
| Q4 2022 | 2.6% |
| Q3 2022 | 4.8% |
| Q2 2022 | 6.4% |
| Q1 2022 | 7.2% |
| Q4 2021 | 8.0% |
| Q3 2021 | 10.4% |
| Q2 2021 | 12.4% |
| Q1 2021 | 11.1% |
| Q4 2020 | 7.5% |
| Q3 2020 | 4.9% |
| Q2 2020 | 2.7% |
| Q1 2020 | 1.9% |
| Q4 2019 | 2.6% |
| Q3 2019 | 2.3% |
| Q2 2019 | 2.0% |
| Q1 2019 | 3.0% |
Rents are up 3.9% on a year ago
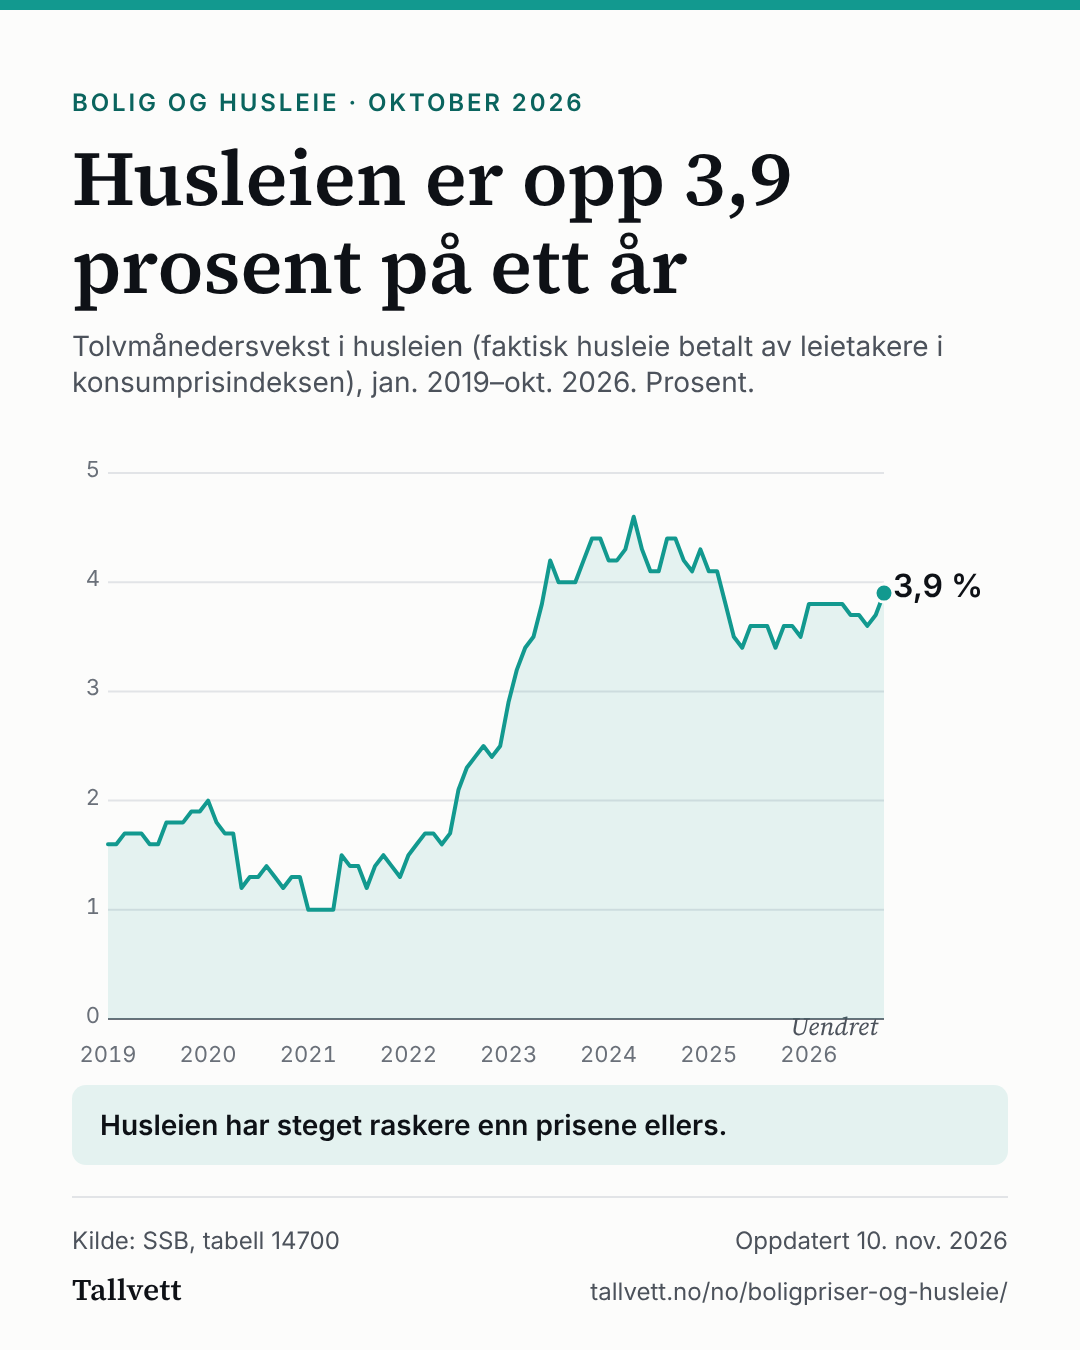
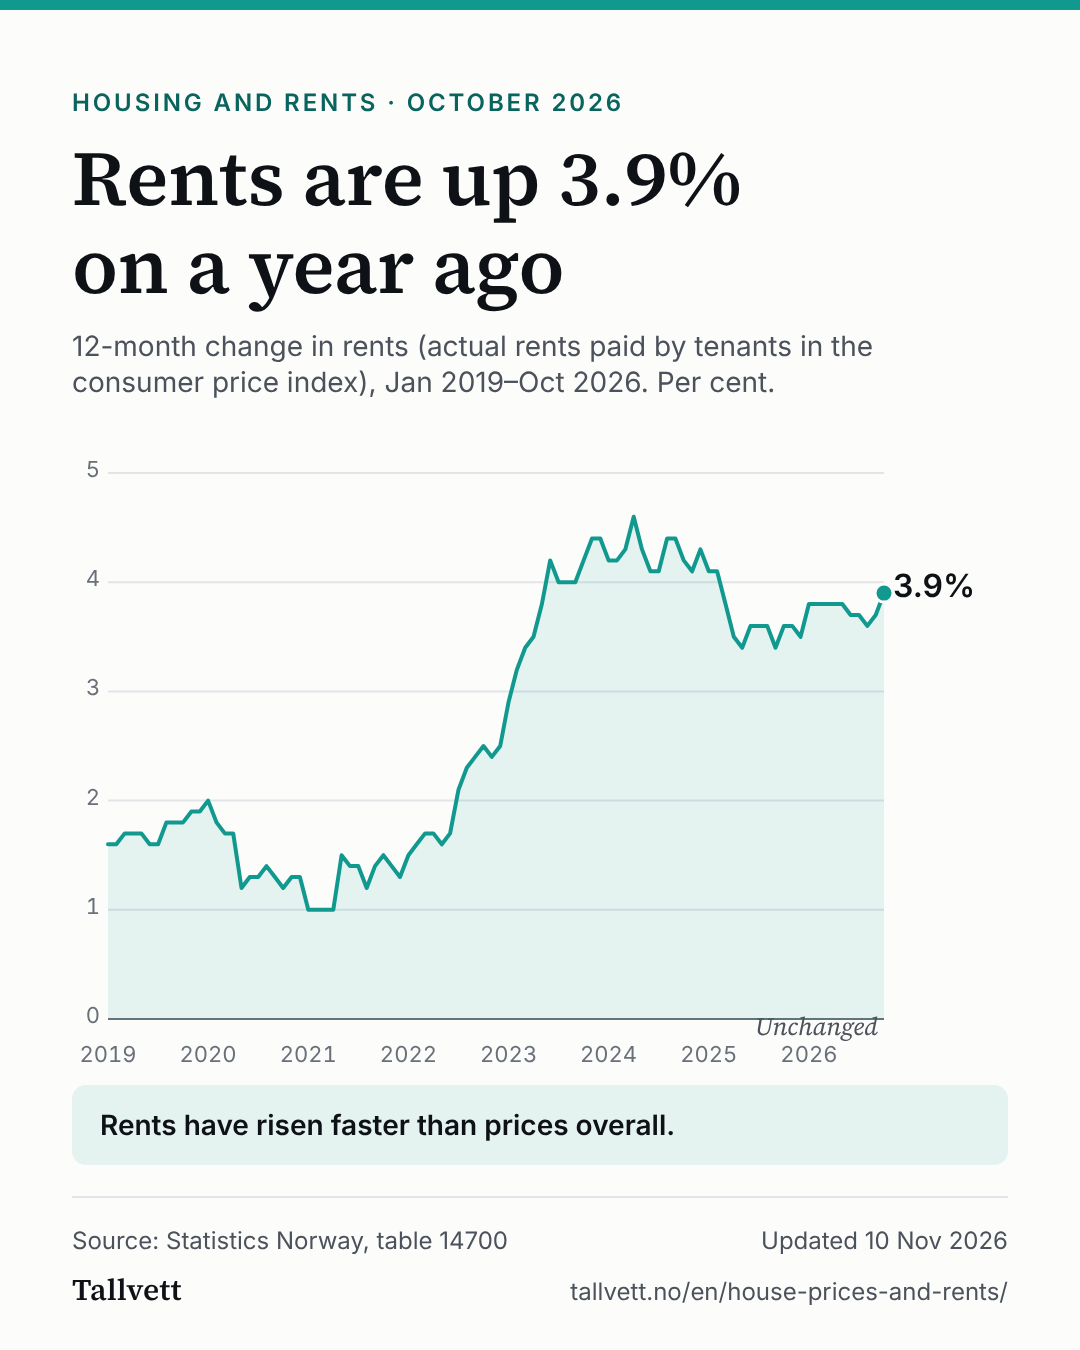
12-month change in rents (actual rents paid by tenants in the consumer price index), Jan 2019–Oct 2026. Per cent.
Line chart of how much rents have changed from the same month a year earlier, from January 2019 to October 2026. The highest value in the period was 4.6% in April 2024. The latest value is 3.9%.
Rents have risen faster than prices overall.
Show the figures as a table
| Period | Rent change |
|---|---|
| Oct 2026 | 3.9% |
| Sep 2026 | 3.7% |
| Aug 2026 | 3.6% |
| Jul 2026 | 3.7% |
| Jun 2026 | 3.7% |
| May 2026 | 3.8% |
| Apr 2026 | 3.8% |
| Mar 2026 | 3.8% |
| Feb 2026 | 3.8% |
| Jan 2026 | 3.8% |
| Dec 2025 | 3.5% |
| Nov 2025 | 3.6% |
| Oct 2025 | 3.6% |
| Sep 2025 | 3.4% |
| Aug 2025 | 3.6% |
| Jul 2025 | 3.6% |
| Jun 2025 | 3.6% |
| May 2025 | 3.4% |
| Apr 2025 | 3.5% |
| Mar 2025 | 3.8% |
| Feb 2025 | 4.1% |
| Jan 2025 | 4.1% |
| Dec 2024 | 4.3% |
| Nov 2024 | 4.1% |
| Oct 2024 | 4.2% |
| Sep 2024 | 4.4% |
| Aug 2024 | 4.4% |
| Jul 2024 | 4.1% |
| Jun 2024 | 4.1% |
| May 2024 | 4.3% |
| Apr 2024 | 4.6% |
| Mar 2024 | 4.3% |
| Feb 2024 | 4.2% |
| Jan 2024 | 4.2% |
| Dec 2023 | 4.4% |
| Nov 2023 | 4.4% |
| Oct 2023 | 4.2% |
| Sep 2023 | 4.0% |
| Aug 2023 | 4.0% |
| Jul 2023 | 4.0% |
| Jun 2023 | 4.2% |
| May 2023 | 3.8% |
| Apr 2023 | 3.5% |
| Mar 2023 | 3.4% |
| Feb 2023 | 3.2% |
| Jan 2023 | 2.9% |
| Dec 2022 | 2.5% |
| Nov 2022 | 2.4% |
| Oct 2022 | 2.5% |
| Sep 2022 | 2.4% |
| Aug 2022 | 2.3% |
| Jul 2022 | 2.1% |
| Jun 2022 | 1.7% |
| May 2022 | 1.6% |
| Apr 2022 | 1.7% |
| Mar 2022 | 1.7% |
| Feb 2022 | 1.6% |
| Jan 2022 | 1.5% |
| Dec 2021 | 1.3% |
| Nov 2021 | 1.4% |
| Oct 2021 | 1.5% |
| Sep 2021 | 1.4% |
| Aug 2021 | 1.2% |
| Jul 2021 | 1.4% |
| Jun 2021 | 1.4% |
| May 2021 | 1.5% |
| Apr 2021 | 1.0% |
| Mar 2021 | 1.0% |
| Feb 2021 | 1.0% |
| Jan 2021 | 1.0% |
| Dec 2020 | 1.3% |
| Nov 2020 | 1.3% |
| Oct 2020 | 1.2% |
| Sep 2020 | 1.3% |
| Aug 2020 | 1.4% |
| Jul 2020 | 1.3% |
| Jun 2020 | 1.3% |
| May 2020 | 1.2% |
| Apr 2020 | 1.7% |
| Mar 2020 | 1.7% |
| Feb 2020 | 1.8% |
| Jan 2020 | 2.0% |
| Dec 2019 | 1.9% |
| Nov 2019 | 1.9% |
| Oct 2019 | 1.8% |
| Sep 2019 | 1.8% |
| Aug 2019 | 1.8% |
| Jul 2019 | 1.6% |
| Jun 2019 | 1.6% |
| May 2019 | 1.7% |
| Apr 2019 | 1.7% |
| Mar 2019 | 1.7% |
| Feb 2019 | 1.6% |
| Jan 2019 | 1.6% |
How this was made
- House prices are Statistics Norway's price index for existing dwellings, for all dwelling types in the whole country (table 07221). Statistics Norway gives only the index level. We calculated the 12-month change ourselves: the index in a quarter divided by the index in the same quarter a year earlier, minus 1.
- Rents are Statistics Norway's 12-month change in the consumer price index for actual rents paid by tenants for their main residence (table 14700, group 04.1.1). It is Statistics Norway's own figure; we have not calculated it. Prices overall are the 12-month change of the consumer price index as a whole, from the same table.
- House prices are quarterly and rents are monthly. The text therefore always says which period each figure is for, and the two figures are not from the same date.
- The rent index follows how rents have changed for people who rent. It does not show what it costs to rent a home today.
- Statistics Norway publishes new house prices once a quarter and new rent figures once a month. This page updates automatically after each release.
Statistics Norway's notes on table 07221
- .. = Data not available. Figures have not been entered into our databases or are too unreliable to be published.
Statistics Norway's notes on table 14700
- On sub-group levels a code is attached to the text, meaning services (S), non-durables (ND), semi-durables (SD) or durables (D).
- This table replaces table 03013. As of 2026 the reference year is 2025=100. Rates of change calculated from the 2015=100 series may differ from published rates of change before 2026 with another reference year. The deviations are mainly due to rounding effects. See the completed table 03013 for published rates of change for the period 2017 to 2025 with 2015=100, or table 11446 for published rates of change figures through 2016 with 1998=100. As of January 2016 UNs' consumer classification COICOP2018 is applied.
- .. = Data not available. Figures have not been entered into our databases or are too unreliable to be published.
- . = Category not applicable. Figures do not exist at this time, because the category was not in use when the figures were collected.
Read more about the house price statistics at Statistics Norway