7 of 13 main groups have risen faster than prices overall
7 of 13 main groups have risen faster than prices overall
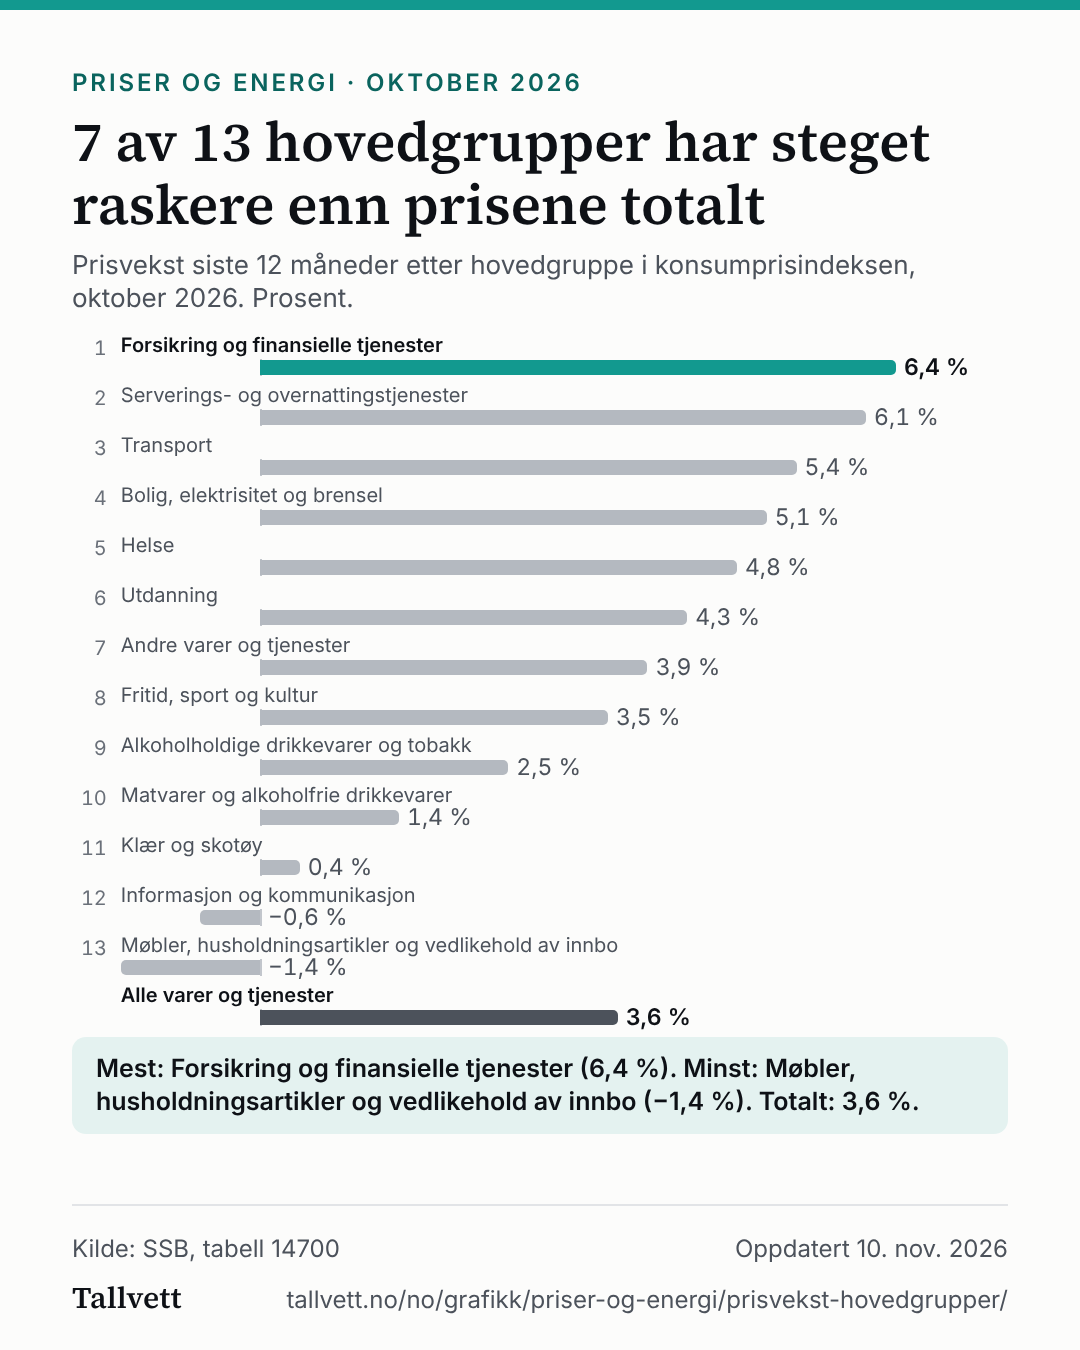
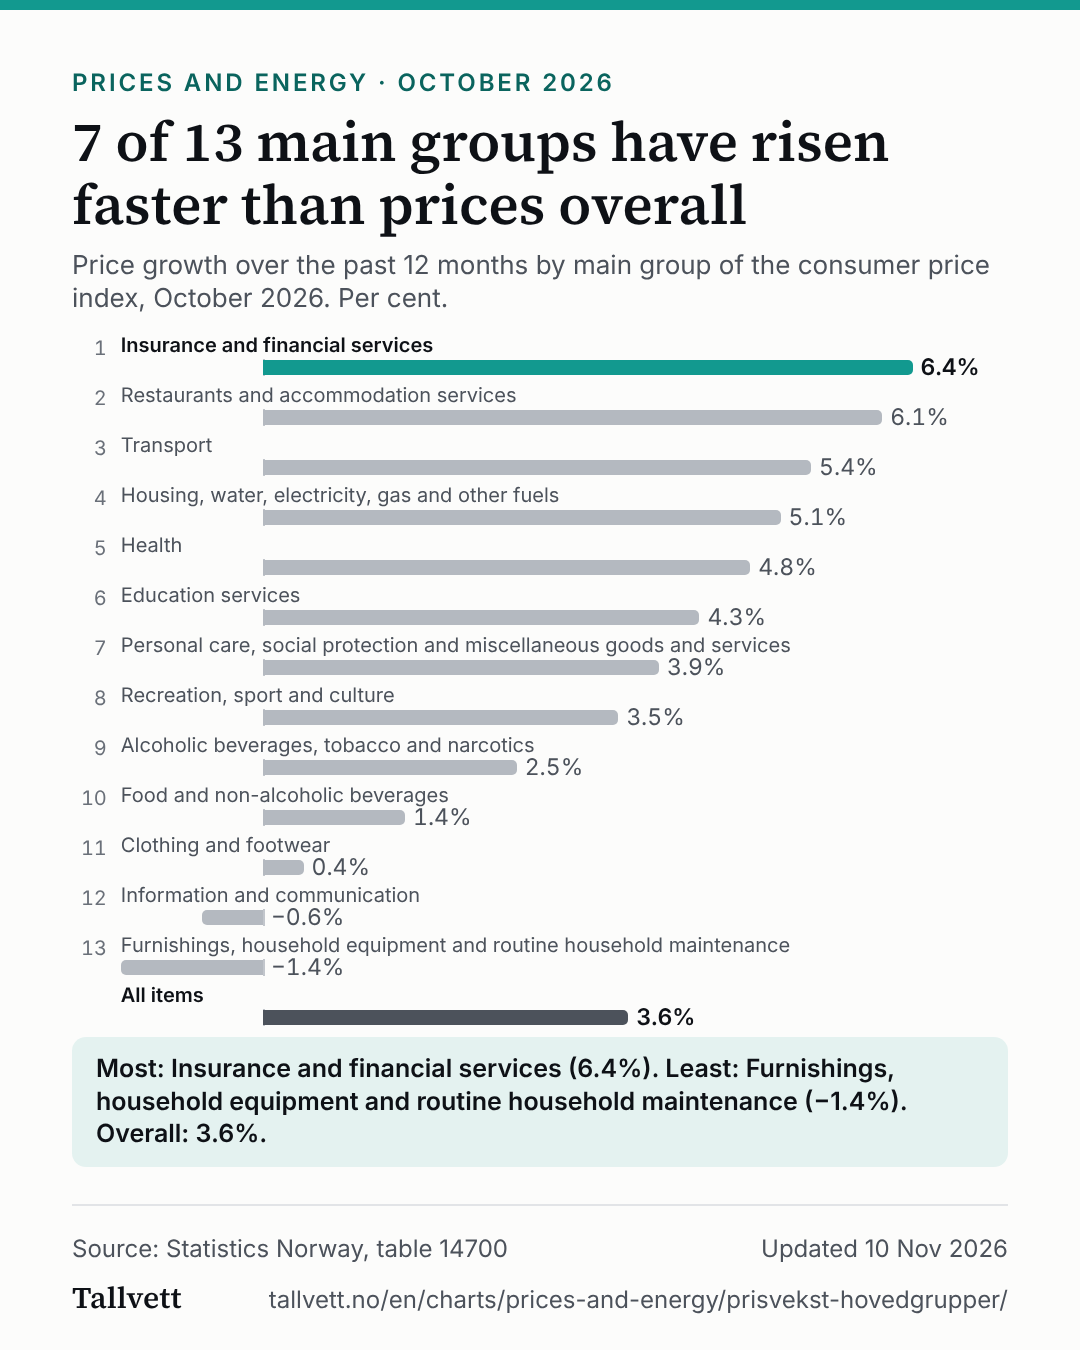
Price growth over the past 12 months by main group of the consumer price index, October 2026. Per cent.
Ranked list of price growth over the past 12 months for the main groups of the consumer price index, October 2026. 1. Insurance and financial services: 6.4%; 2. Restaurants and accommodation services: 6.1%; 3. Transport: 5.4%; 4. Housing, water, electricity, gas and other fuels: 5.1%; 5. Health: 4.8%; 6. Education services: 4.3%; 7. Personal care, social protection and miscellaneous goods and services: 3.9%; 8. Recreation, sport and culture: 3.5%; 9. Alcoholic beverages, tobacco and narcotics: 2.5%; 10. Food and non-alcoholic beverages: 1.4%; 11. Clothing and footwear: 0.4%; 12. Information and communication: −0.6%; 13. Furnishings, household equipment and routine household maintenance: −1.4%; All items: 3.6%.
- Insurance and financial services6.4%
- Restaurants and accommodation services6.1%
- Transport5.4%
- Housing, water, electricity, gas and other fuels5.1%
- Health4.8%
- Education services4.3%
- Personal care, social protection and miscellaneous goods and services3.9%
- Recreation, sport and culture3.5%
- Alcoholic beverages, tobacco and narcotics2.5%
- Food and non-alcoholic beverages1.4%
- Clothing and footwear0.4%
- Information and communication−0.6%
- Furnishings, household equipment and routine household maintenance−1.4%
- All items3.6%
Most: Insurance and financial services (6.4%). Least: Furnishings, household equipment and routine household maintenance (−1.4%). Overall: 3.6%.
Show the figures as a table
| Main group | Price growth, past 12 months |
|---|---|
| 1. Insurance and financial services | 6.4% |
| 2. Restaurants and accommodation services | 6.1% |
| 3. Transport | 5.4% |
| 4. Housing, water, electricity, gas and other fuels | 5.1% |
| 5. Health | 4.8% |
| 6. Education services | 4.3% |
| 7. Personal care, social protection and miscellaneous goods and services | 3.9% |
| 8. Recreation, sport and culture | 3.5% |
| 9. Alcoholic beverages, tobacco and narcotics | 2.5% |
| 10. Food and non-alcoholic beverages | 1.4% |
| 11. Clothing and footwear | 0.4% |
| 12. Information and communication | −0.6% |
| 13. Furnishings, household equipment and routine household maintenance | −1.4% |
| All items | 3.6% |
How this chart was made
- The figures are Statistics Norway's own, from table 14700: the 12-month change of the consumer price index for each of the 13 main groups and for the index as a whole. We have not calculated them.
- The headline counts the main groups with higher growth than the total. That is the only calculation.
- A negative value means prices in the group are lower than a year ago.
Statistics Norway's notes on the table
- On sub-group levels a code is attached to the text, meaning services (S), non-durables (ND), semi-durables (SD) or durables (D).
- This table replaces table 03013. As of 2026 the reference year is 2025=100. Rates of change calculated from the 2015=100 series may differ from published rates of change before 2026 with another reference year. The deviations are mainly due to rounding effects. See the completed table 03013 for published rates of change for the period 2017 to 2025 with 2015=100, or table 11446 for published rates of change figures through 2016 with 1998=100. As of January 2016 UNs' consumer classification COICOP2018 is applied.
- .. = Data not available. Figures have not been entered into our databases or are too unreliable to be published.
- . = Category not applicable. Figures do not exist at this time, because the category was not in use when the figures were collected.