Electricity cost households 122.3 øre per kWh in Q2 2026
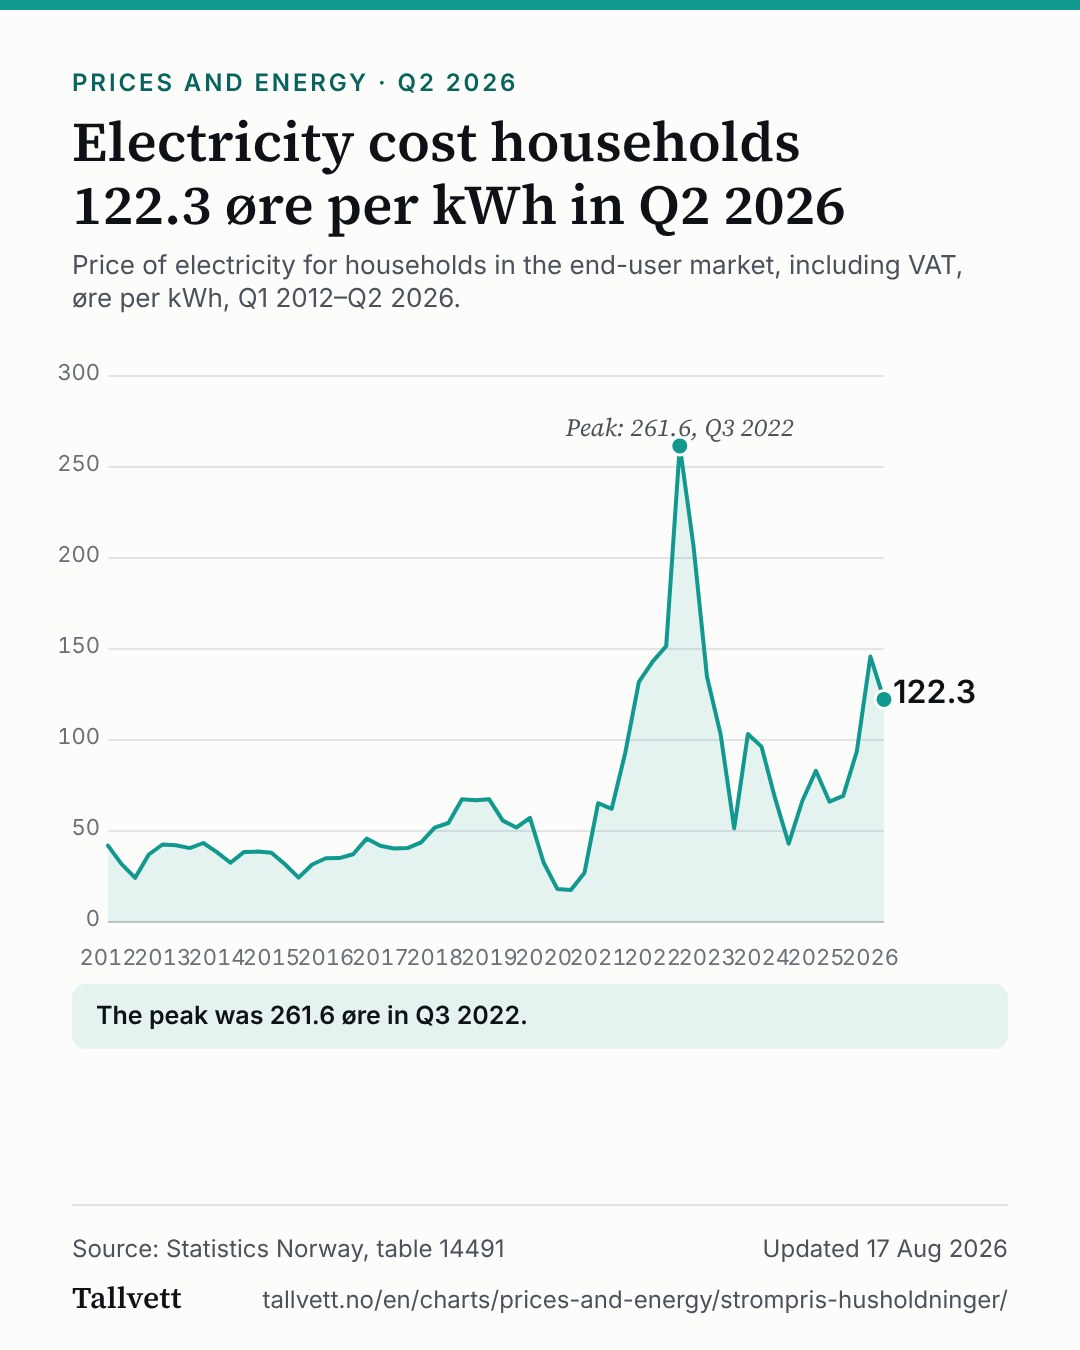
Electricity cost households 122.3 øre per kWh in Q2 2026
Price of electricity for households in the end-user market, including VAT, øre per kWh, Q1 2012–Q2 2026.
Line chart of the electricity price for households per quarter from Q1 2012 to Q2 2026, including VAT, in øre per kWh. The latest value is 122.3 in Q2 2026. The highest value was 261.6 in Q3 2022.
The peak was 261.6 øre in Q3 2022.
Show the figures as a table
| Period | Øre per kWh |
|---|---|
| Q2 2026 | 122.3 |
| Q1 2026 | 145.8 |
| Q4 2025 | 93.7 |
| Q3 2025 | 69.3 |
| Q2 2025 | 66.1 |
| Q1 2025 | 83.1 |
| Q4 2024 | 66.5 |
| Q3 2024 | 43.0 |
| Q2 2024 | 67.9 |
| Q1 2024 | 96.4 |
| Q4 2023 | 103.3 |
| Q3 2023 | 51.5 |
| Q2 2023 | 103.2 |
| Q1 2023 | 134.8 |
| Q4 2022 | 207.0 |
| Q3 2022 | 261.6 |
| Q2 2022 | 151.6 |
| Q1 2022 | 143.1 |
| Q4 2021 | 132.0 |
| Q3 2021 | 93.1 |
| Q2 2021 | 62.2 |
| Q1 2021 | 65.3 |
| Q4 2020 | 27.1 |
| Q3 2020 | 17.6 |
| Q2 2020 | 18.2 |
| Q1 2020 | 32.7 |
| Q4 2019 | 57.2 |
| Q3 2019 | 51.9 |
| Q2 2019 | 55.7 |
| Q1 2019 | 67.4 |
| Q4 2018 | 66.9 |
| Q3 2018 | 67.5 |
| Q2 2018 | 54.4 |
| Q1 2018 | 51.8 |
| Q4 2017 | 43.8 |
| Q3 2017 | 40.6 |
| Q2 2017 | 40.4 |
| Q1 2017 | 41.9 |
| Q4 2016 | 45.8 |
| Q3 2016 | 37.2 |
| Q2 2016 | 35.1 |
| Q1 2016 | 35.0 |
| Q4 2015 | 31.6 |
| Q3 2015 | 24.4 |
| Q2 2015 | 31.7 |
| Q1 2015 | 38.1 |
| Q4 2014 | 38.7 |
| Q3 2014 | 38.5 |
| Q2 2014 | 32.5 |
| Q1 2014 | 38.4 |
| Q4 2013 | 43.4 |
| Q3 2013 | 40.6 |
| Q2 2013 | 42.2 |
| Q1 2013 | 42.6 |
| Q4 2012 | 37.1 |
| Q3 2012 | 24.3 |
| Q2 2012 | 31.8 |
| Q1 2012 | 42.0 |
How this chart was made
- The figures are Statistics Norway's own, from table 14491: the average price of electricity for households in the end-user market, all contract types together, including VAT. We have not calculated them.
- The price is in øre per kilowatt hour (kWh). 100 øre is one krone.