Pay and prices · Updated 10 Nov 2026
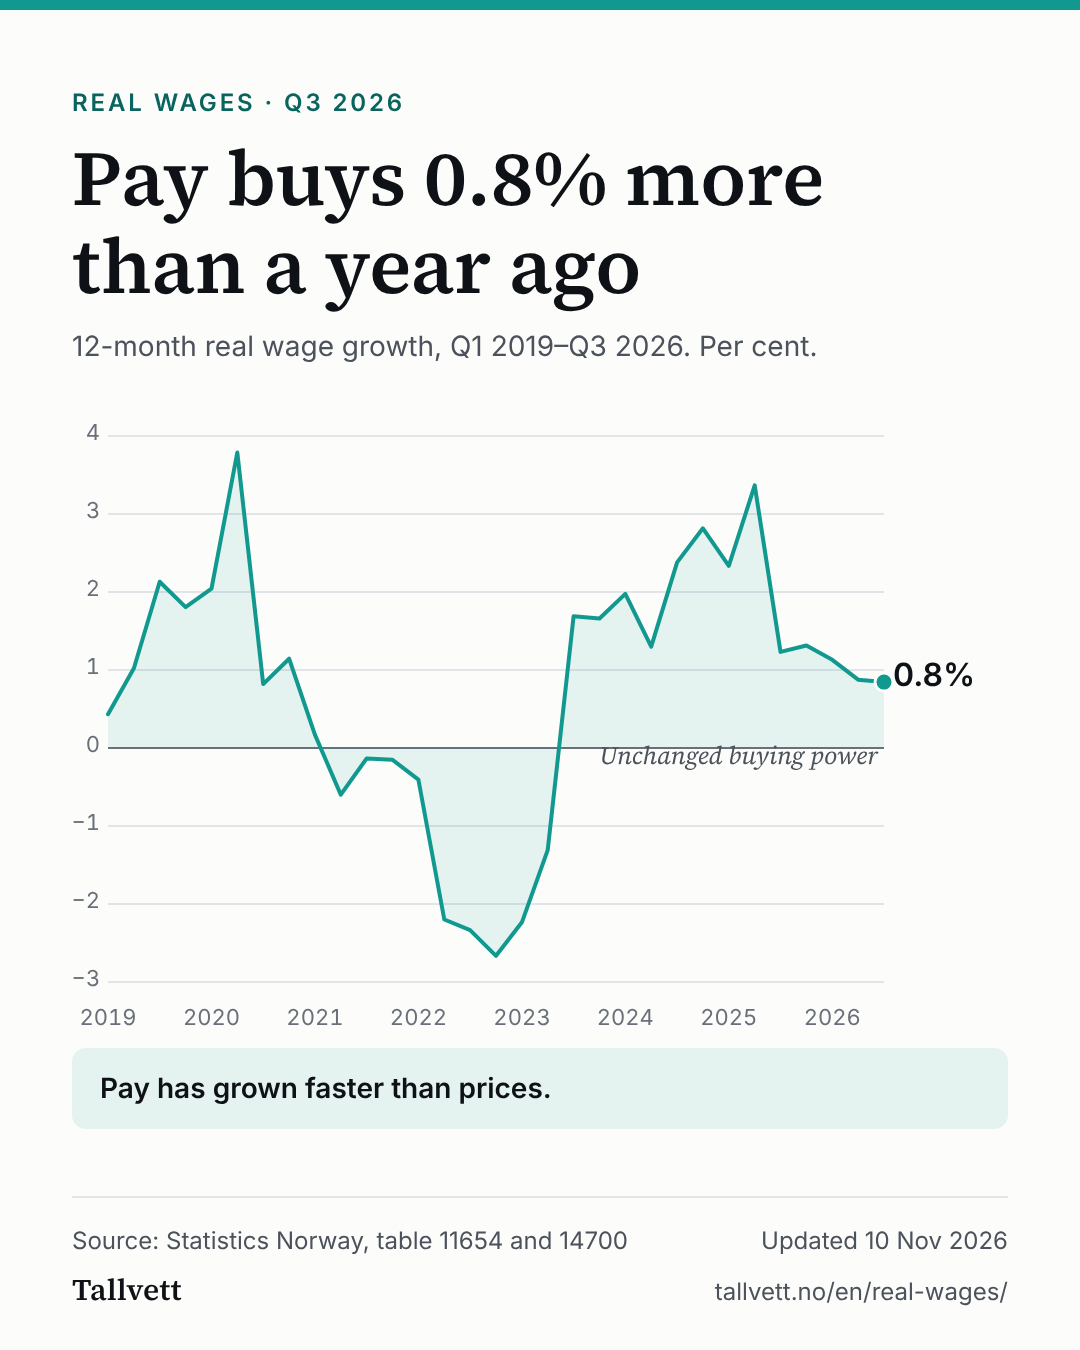
Pay buys 0.8% more than a year ago
Average monthly earnings in Q3 2026 were 4.1% higher than in the same quarter a year earlier, while prices rose 3.2%. Real wage growth is down from 0.9% in Q2 2026. Pay has grown faster than prices.
Pay buys 0.8% more than a year ago
12-month real wage growth, Q1 2019–Q3 2026. Per cent.
Line chart of how much more or less pay buys than in the same quarter a year earlier, from Q1 2019 to Q3 2026. The lowest value in the period was −2.7% in Q4 2022. The latest value is 0.8%.
Pay has grown faster than prices.
Show the figures as a table
| Period | Real wage growth |
|---|---|
| Q3 2026 | 0.8% |
| Q2 2026 | 0.9% |
| Q1 2026 | 1.1% |
| Q4 2025 | 1.3% |
| Q3 2025 | 1.2% |
| Q2 2025 | 3.4% |
| Q1 2025 | 2.3% |
| Q4 2024 | 2.8% |
| Q3 2024 | 2.4% |
| Q2 2024 | 1.3% |
| Q1 2024 | 2.0% |
| Q4 2023 | 1.7% |
| Q3 2023 | 1.7% |
| Q2 2023 | −1.3% |
| Q1 2023 | −2.2% |
| Q4 2022 | −2.7% |
| Q3 2022 | −2.3% |
| Q2 2022 | −2.2% |
| Q1 2022 | −0.4% |
| Q4 2021 | −0.2% |
| Q3 2021 | −0.1% |
| Q2 2021 | −0.6% |
| Q1 2021 | 0.2% |
| Q4 2020 | 1.1% |
| Q3 2020 | 0.8% |
| Q2 2020 | 3.8% |
| Q1 2020 | 2.0% |
| Q4 2019 | 1.8% |
| Q3 2019 | 2.1% |
| Q2 2019 | 1.0% |
| Q1 2019 | 0.4% |
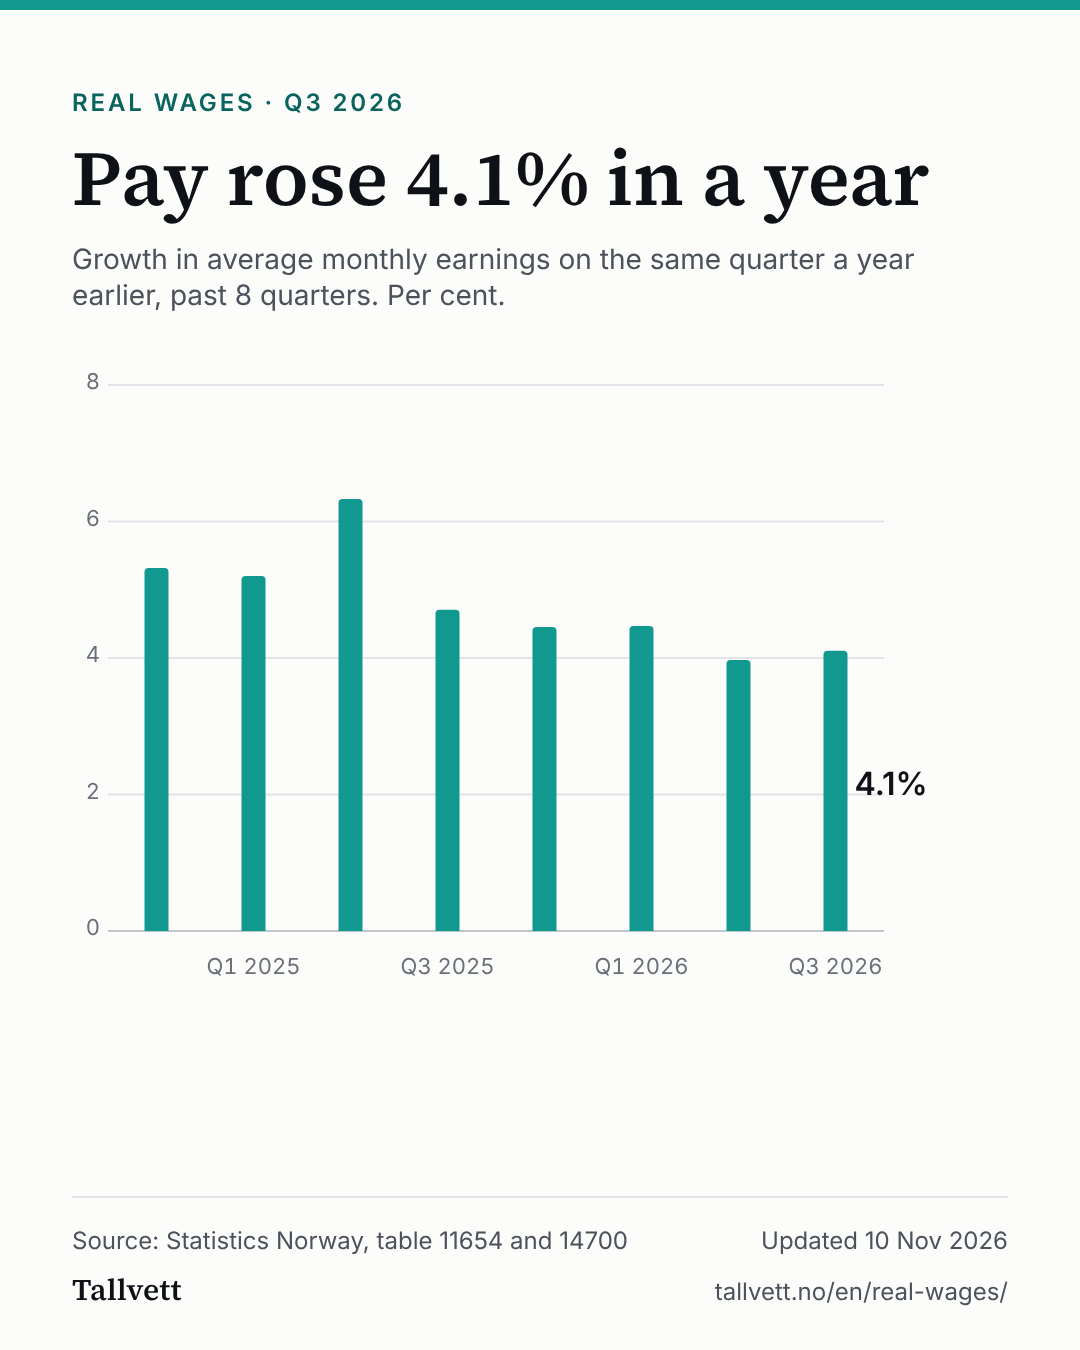
Pay rose 4.1% in a year
Growth in average monthly earnings on the same quarter a year earlier, past 8 quarters. Per cent.
Bar chart of earnings growth on the same quarter a year earlier over the past 8 quarters. Latest quarter: 4.1%.
Show the figures as a table
| Period | Earnings growth |
|---|---|
| Q3 2026 | 4.1% |
| Q2 2026 | 4.0% |
| Q1 2026 | 4.5% |
| Q4 2025 | 4.5% |
| Q3 2025 | 4.7% |
| Q2 2025 | 6.3% |
| Q1 2025 | 5.2% |
| Q4 2024 | 5.3% |
How this was made
- Pay is Statistics Norway's earnings index for average monthly earnings (table 11654). Prices are Statistics Norway's 12-month change in the consumer price index (table 14700). Both are Statistics Norway's own figures.
- Real wage growth we have calculated ourselves. We compare the earnings index in a quarter with the same quarter a year earlier, and take the average of price growth over the quarter's three months. Real wage growth is (1 + earnings growth) divided by (1 + price growth), minus 1. That way pay and prices are compared at the same point in time.
- Earnings are an average per full-time equivalent, measured in the middle month of the quarter. They include basic pay, supplements and bonuses, but not overtime. A quarter can therefore be affected by when bonuses are paid. Statistics Norway does not say whether the index is adjusted for changes in who is employed.
- The figures are the average for all employees in Norway. Your own pay and your own spending may have developed differently.
- Statistics Norway publishes new earnings figures once a quarter. This page updates automatically after each release.
Statistics Norway's notes on table 11654
- Average basic monthly earnings and average monthly earnings are published in Norwegian NOK and rounded off to the nearest ten. Earnings are published both in the number of employments and earnings statistics and the yearly earnings statistics.
- All 1s and 2s have been replaced by 0 or 3 in order to meet privacy requirement. When the figures are aggregated to a higher regional level, the sum may differ slightly from the actual figure.
- Establishments in the industrial classification 09.1 Support activities for petroleum and natural gas extraction, and some other industries, are given a land code from the Central Coordinating Register for Legal Entities, even where operations are carried out on the Norwegian continental shelf. Previously, establishments that Statistics Norway considered to be on the continental shelf were given a new code. However, this procedure has been discontinued. This means that many jobs that were previously registered under the Norwegian continental shelf are now considered to be on the Norwegian mainland. This has further led to an artificial decrease in the number of employed persons on the Norwegian continental shelf and a corresponding artificial increase in other counties, mainly in Rogaland and Hordaland. The biggest changes occur in second quarter of 2018 (mainly the industrial classification 09.1) and third quarter of 2019 (mainly the industrial classification 09.1 and industries related to catering).
- Changes in reporting in the first quarter of 2020 have led to improved quality in the information on wages. The changes have resulted in an increased wage level. The most noticeable change has been in the industry division 05-09 Mining and quarrying where the average monthly basic earnings have increased by 0,8 percent, and monthly earnings have increased by 0,6 percent. Within this industry division the changes are most noticeable in 06 Extraction of oil and natural gas, with an increase in monthly basic earnings by 1,6 percent, and monthly earnings by 1,2 percent. The changes in reporting will also affect other classifications (occupation, place of work etc.) to a varying degree.
- Previously published figures can be found in the following tables: 13240 and 13241 under 'Closed time series' in the Statbank. The change is due to the implementation of a new method for calculating working hours. As a result the agreed fulltime equivalent (FTE) percentage has been adjusted in the instances where the information is insufficient or missing. More information about the method can be found in the article mentioned above. The new method means that we get some changes in the composition of full-time and part-time work. If the FTE percentage change compared to the previous methodology, the monthly earnings per full-time equivalent will also be affected.
- The wage-term average monthly earnings contained errors and was updated with the correct numbers for all quarters on November 30th 2021. Average basic monthly earnings was not affected by the error. This update resulted in a consequential error in the index of average monthly earnings in table 11654 and table 12314. Several quarterly figures were not estimated with the updated figures for average monthly earnings for the relevant base periods, but the old figures. Table 11654 was corrected on 9 June 2022 and table 12314 was corrected on 14 September 2022.
- From the publication of figures for the first quarter of 2024 onwards, the base period for the earnings indexes has been changed to the 1st quarter of 2024. Previously, the base period was the 1st quarter of 2016. The change applies to all time series covering the whole country. For time series distributed by county, this change applies only to counties that exist as of January 2024. Thus, the county-distributed time series have different base periods, depending on when the counties exist: - Counties that exist as of January 2024 have the 1st quarter of 2024 as the base period. -- Counties with gaps in the time series between January 2016 and January 2024, such as Akershus and Buskerud, among others, have different base periods before and after the gap. - Counties that existed as of January 2016, but not as of January 2024, have the 1st quarter of 2016 as the base period. - Counties established after January 2016, that does not exist as of January 2024, have the first quarter after they were established as the base period.
Statistics Norway's notes on table 14700
- On sub-group levels a code is attached to the text, meaning services (S), non-durables (ND), semi-durables (SD) or durables (D).
- This table replaces table 03013. As of 2026 the reference year is 2025=100. Rates of change calculated from the 2015=100 series may differ from published rates of change before 2026 with another reference year. The deviations are mainly due to rounding effects. See the completed table 03013 for published rates of change for the period 2017 to 2025 with 2015=100, or table 11446 for published rates of change figures through 2016 with 1998=100. As of January 2016 UNs' consumer classification COICOP2018 is applied.
- .. = Data not available. Figures have not been entered into our databases or are too unreliable to be published.
Read more about the earnings statistics at Statistics Norway